IB DP Maths: AI HL复习笔记1.4.2 Amortisation & Annuities
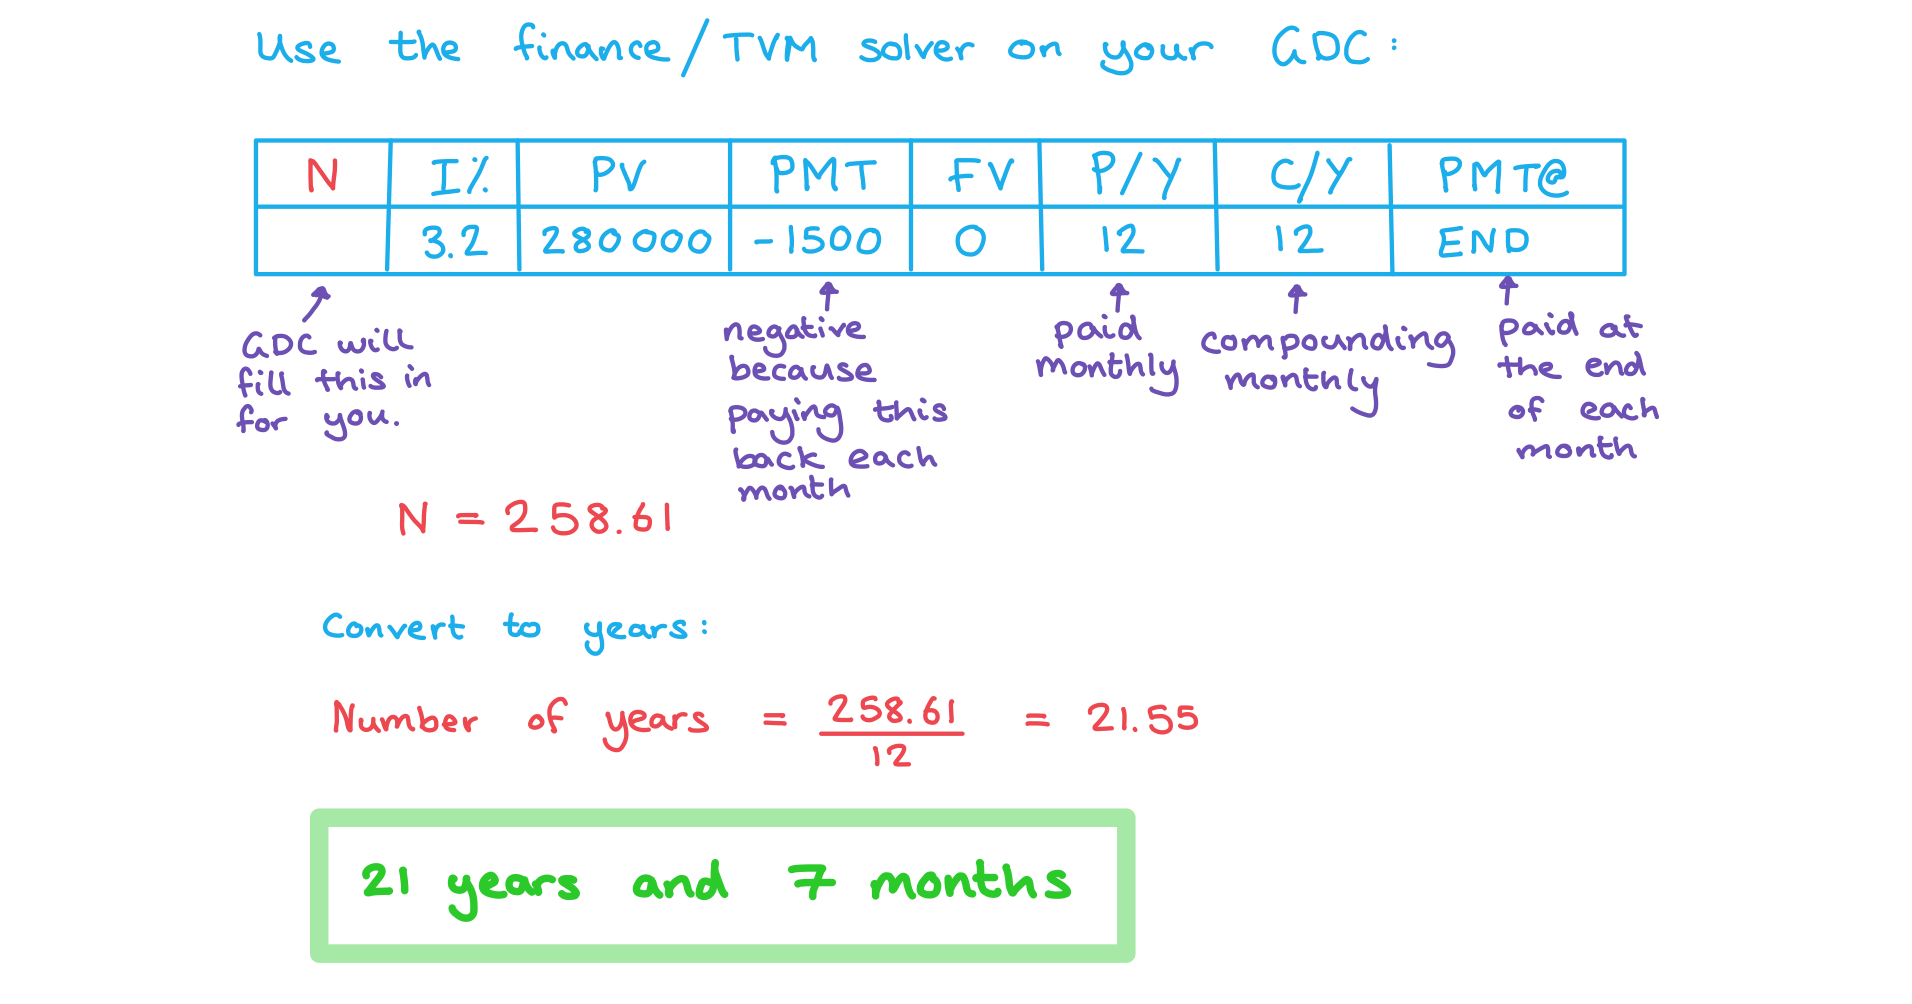
Amortisation What is amortisation? Amortisation is the process of repaying a loan over a fixed period of time Most commonly questions will be about mortgages (loans taken out to buy a home) or loan...