- 翰林提供学术活动、国际课程、科研项目一站式留学背景提升服务!
- 400 888 0080
EDEXCEL IGCSE CHEMISTRY: DOUBLE SCIENCE 复习笔记:3.2.1 Measuring Rates
EDEXCEL IGCSE CHEMISTRY: DOUBLE SCIENCE 复习笔记:3.2.1 Measuring Rates
Measuring Rates
- You should be able to describe experiments to investigate the effect of surface area, concentration, temperature and a catalyst on a rate of reaction
Effect of surface area of a solid on the rate of reaction
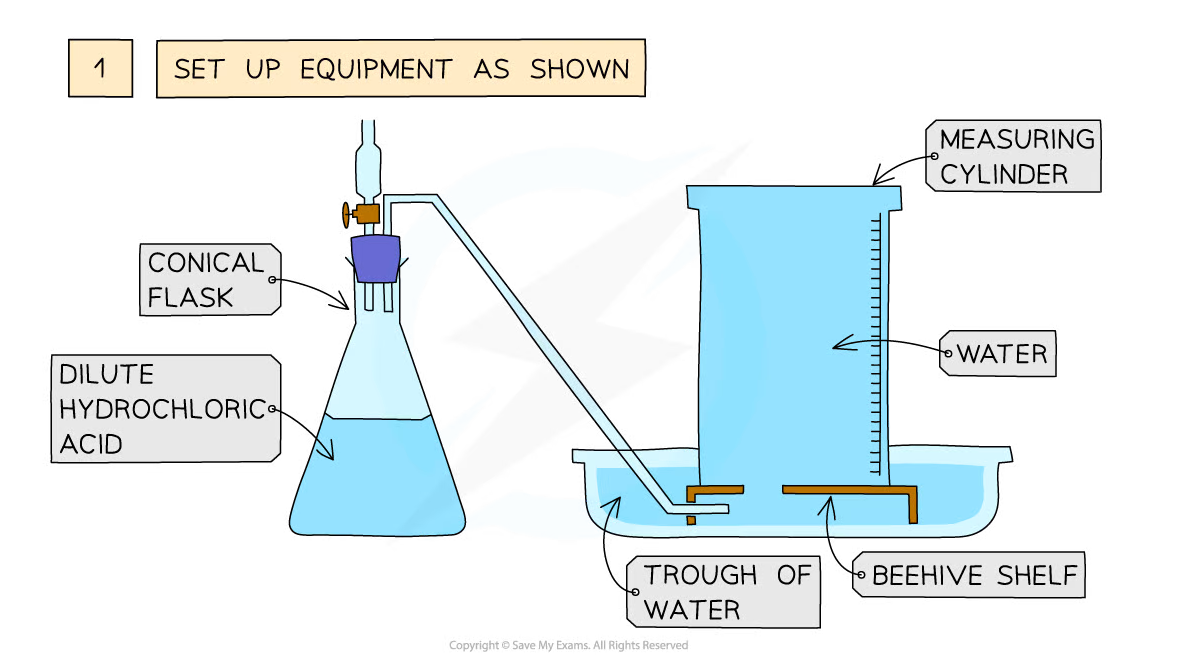
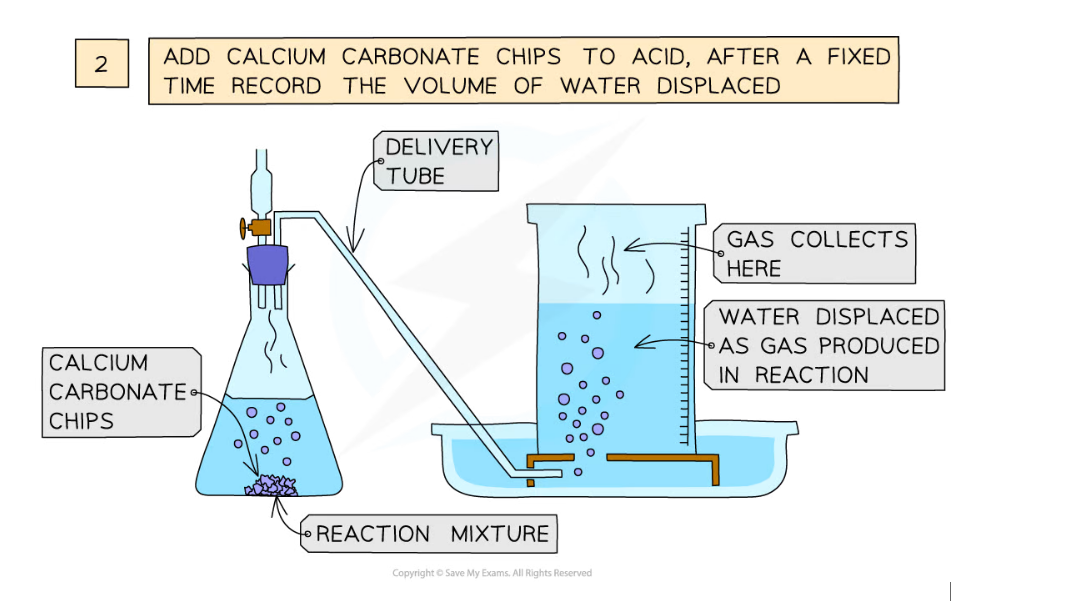
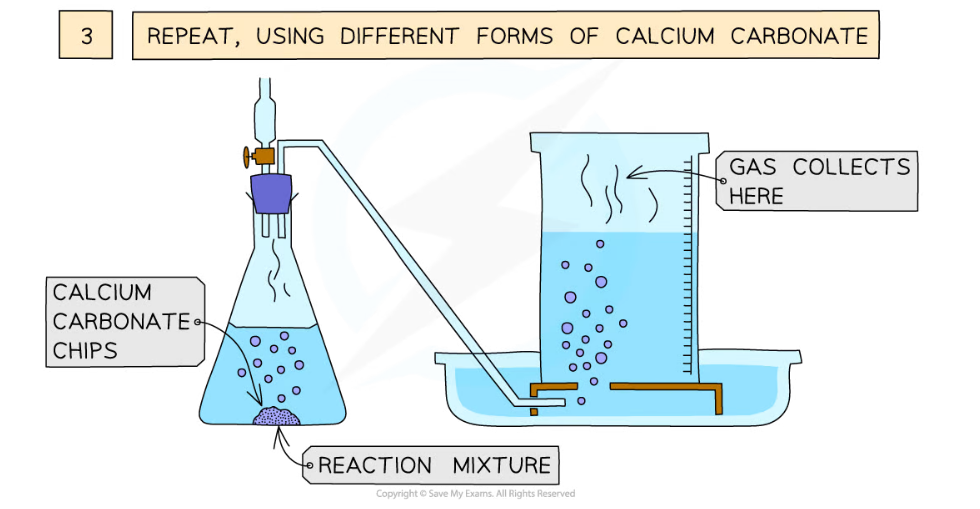
Diagram showing the process of downwards displacement to investigate the effect of the surface area of a solid on the rate of reaction
Method:
- Add dilute hydrochloric acid to the conical flask
- Use a delivery tube to connect this flask to an inverted measuring cylinder upside down in a water trough
- Add calcium carbonate chips into the conical flask and close the bung
- Measure the volume of gas produced in a fixed time using the measuring cylinder
- Repeat with different sizes of calcium carbonate chips
Effect of concentration of a solution on the rate of reaction
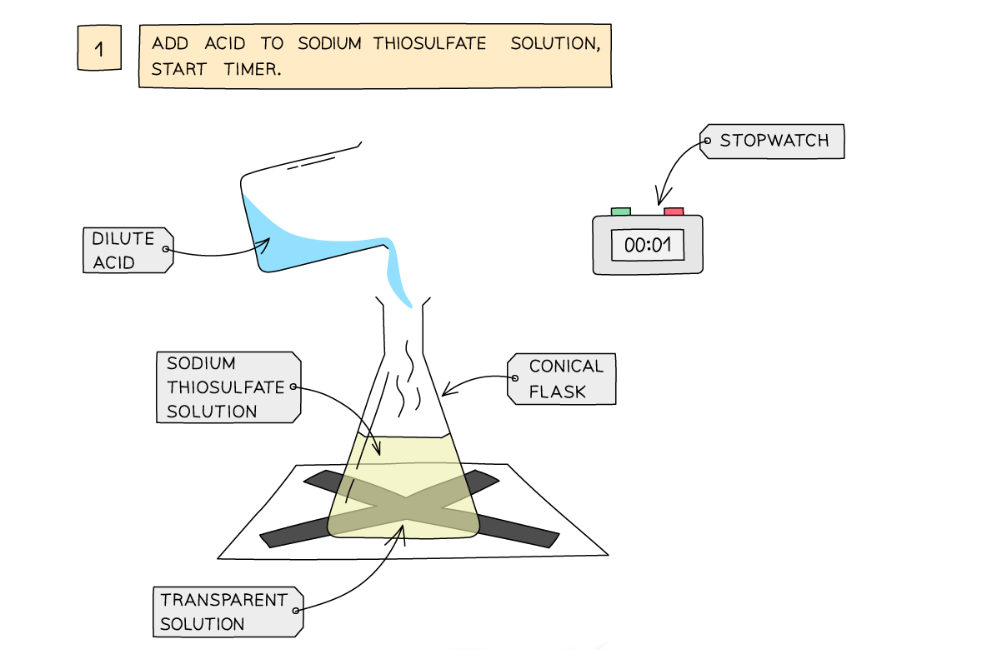
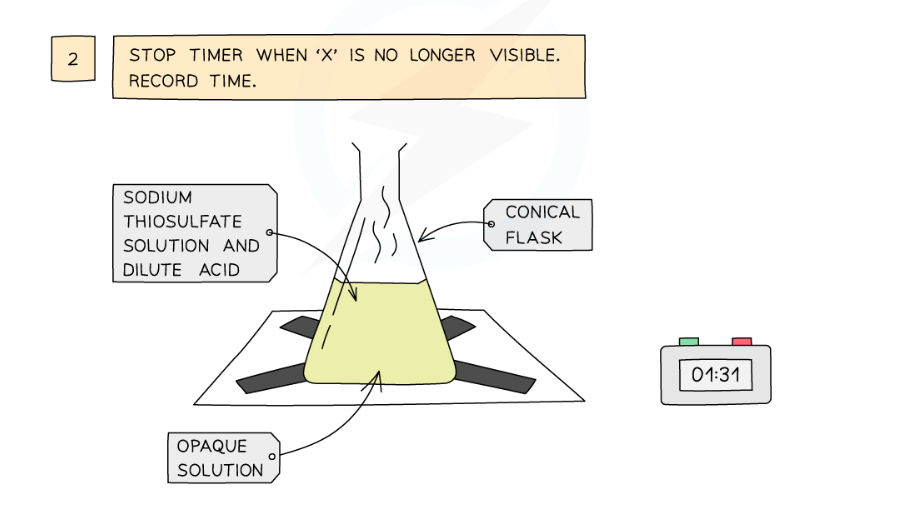
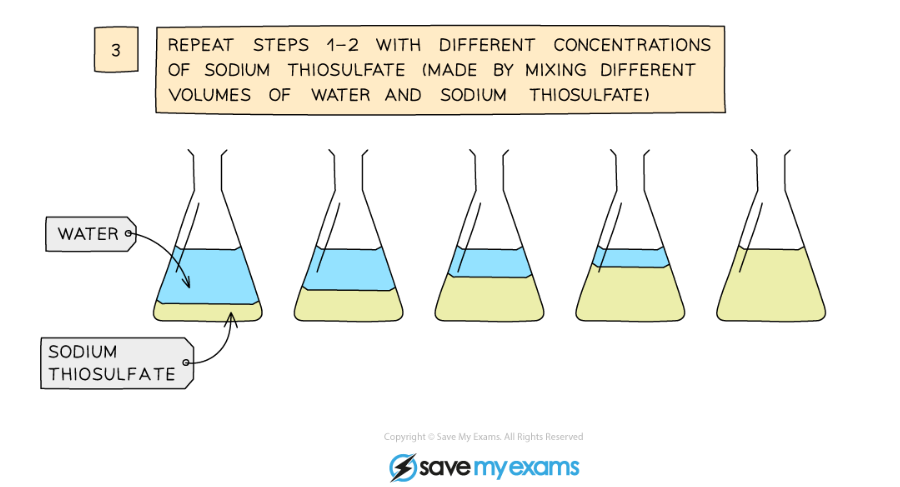
Diagram showing the apparatus needed to investigate the effect of concentration on the rate of reaction
Method:
- Measure 50 cm3 of sodium thiosulfate solution into a flask
- Measure 5 cm3 of dilute hydrochloric acid into a measuring cylinder
- Draw a cross on a piece of paper and put it underneath the flask
- Add the acid into the flask and immediately start the stopwatch
- Look down at the cross from above and stop the stopwatch when the cross can no longer be seen
- Repeat using different concentrations of sodium thiosulfate solution (mix different volumes of sodium thiosulfate solution with water to dilute it)
Result:
- With an increase in the concentration of a solution, the rate of reaction will increase
- This is because there will be more reactant particles in a given volume, allowing more frequent and successful collisions, increasing the rate of reaction
Effect of temperature on the rate of reaction
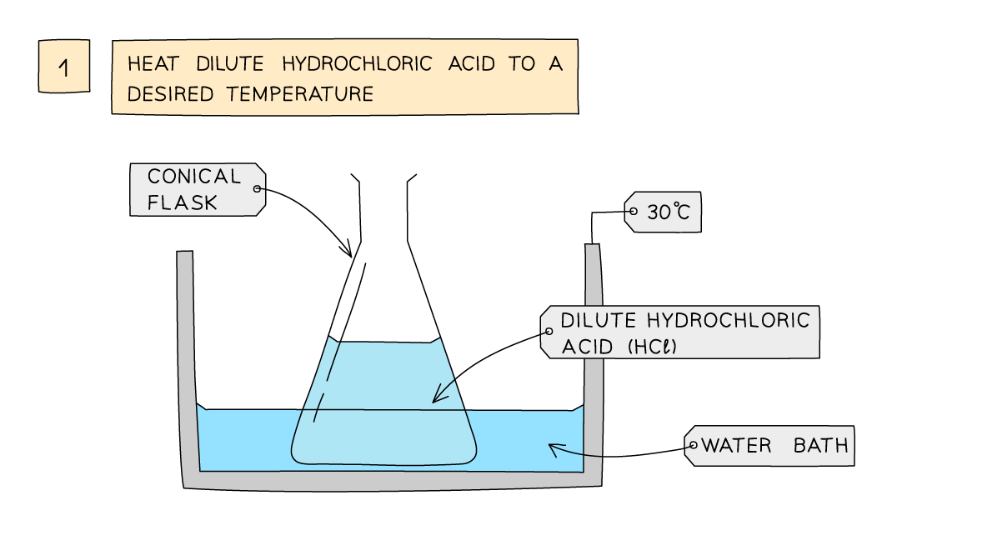
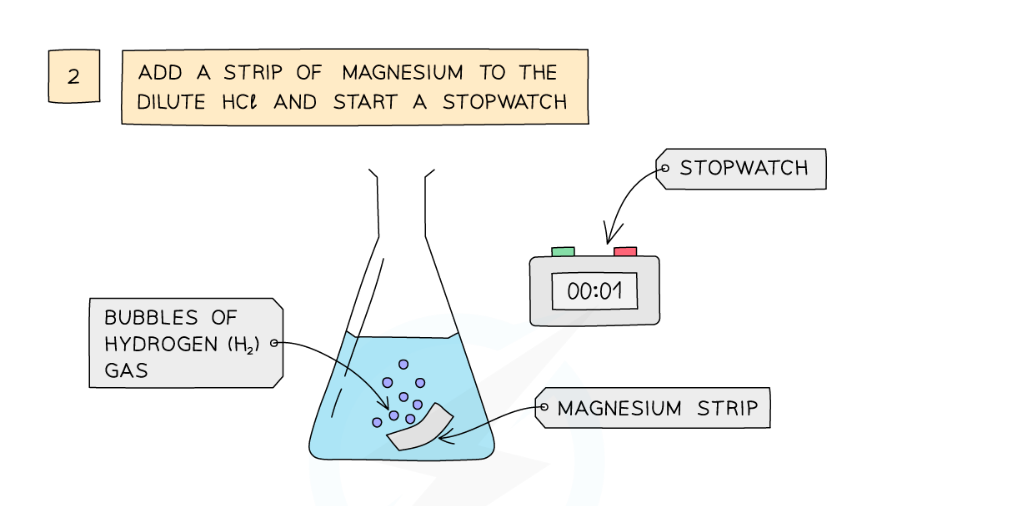
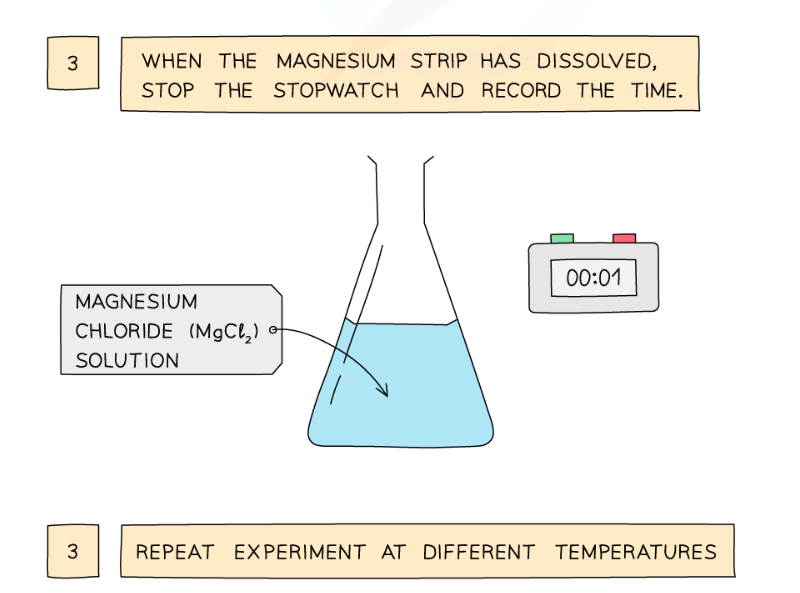
Diagram showing the apparatus needed to investigate the effect of temperature on the rate of reaction
Method:
- Dilute hydrochloric acid is heated to a set temperature using a water bath
- Add the dilute hydrochloric acid into a conical flask
- Add a strip of magnesium and start the stopwatch
- Stop the time when the magnesium fully dissolves
- Repeat at different temperatures and compare results
Result:
- With an increase in the temperature, the rate of reaction will increase
- This is because the particles will have more kinetic energy than the required activation energy, therefore more frequent and successful collisions will occur, increasing the rate of reaction
Effect of a catalyst on the rate of reaction
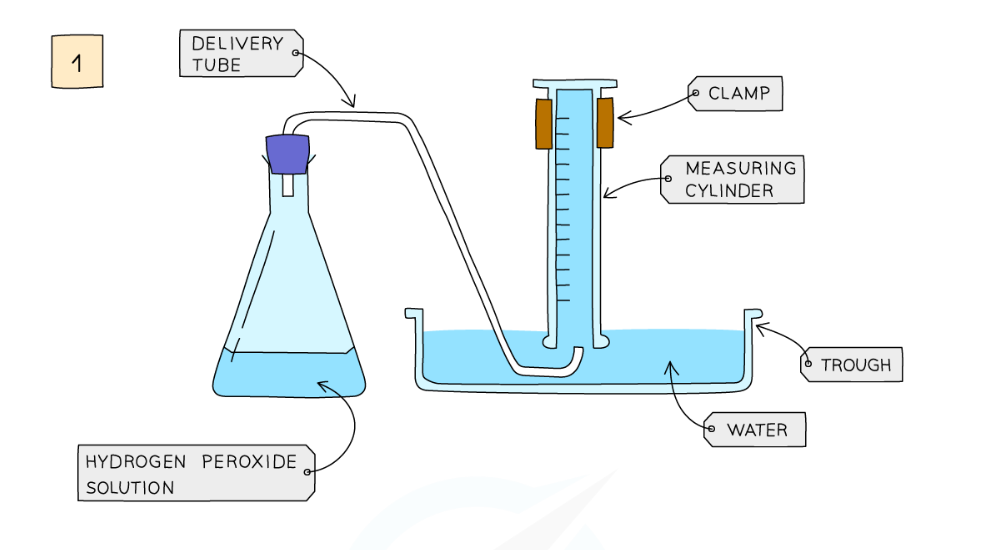
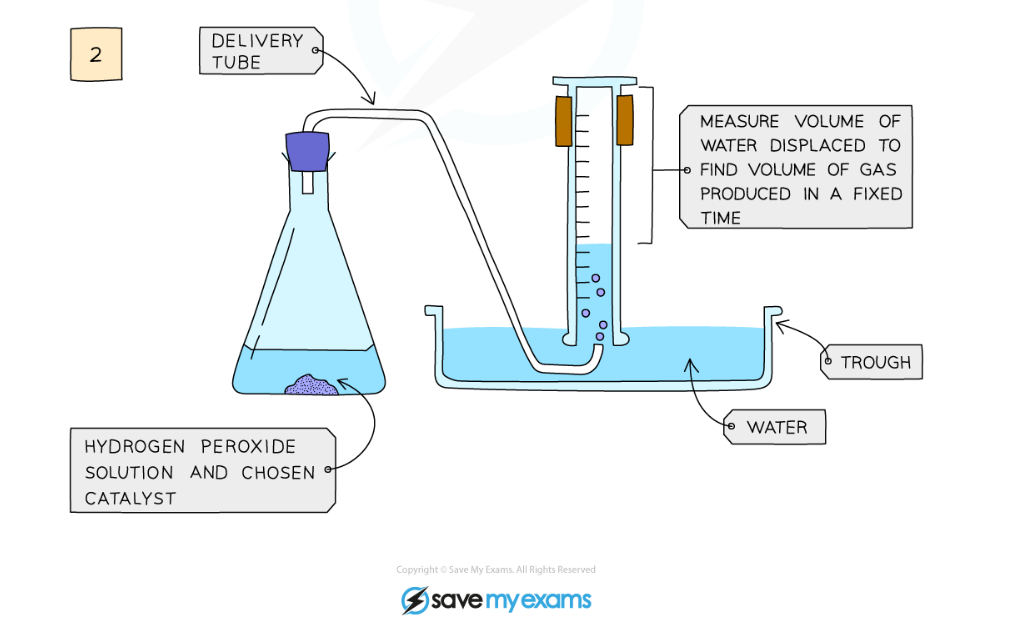
Diagram showing the apparatus needed to investigate the effect of a catalyst on the rate of reaction
Method:
- Add hydrogen peroxide into a conical flask
- Use a delivery tube to connect this flask to a measuring cylinder upside down in water trough
- Add the catalyst manganese(IV) oxide into the conical flask and close the bung
- Measure the volume of gas produced in a fixed time using the measuring cylinder
- Repeat experiment without the catalyst of manganese(IV) oxide and compare results
Factors Affecting Rates
- There are several factors that can affect the rate of a reaction. These are:
- Concentration of the reactants in solution
- Temperature at which the reaction is carried out
- Surface area of solid reactants
- The use of a catalyst
- Changes in these factors directly influence the rate of a reaction
- It is of economic interest to have a higher rate of reaction as this implies a higher rate of production and hence a more efficient and sustainable process
The Effect of Increased Concentration
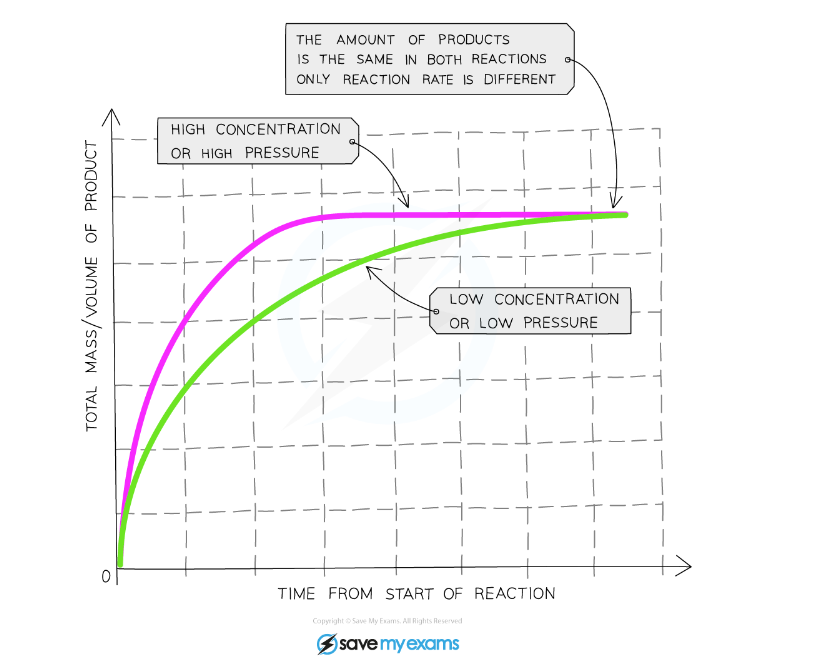
Graph showing the effect of the concentration of a solution or gas pressure on the rate of reaction
Explanation:
- Compared to a reaction with a reactant at a low concentration, the graph line for the same reaction but at a higher concentration/pressure has a steeper gradient at the start and becomes horizontal sooner
- This shows that with increased concentration of a solution, the rate of reaction will increase
Effect of Increasing Temperature
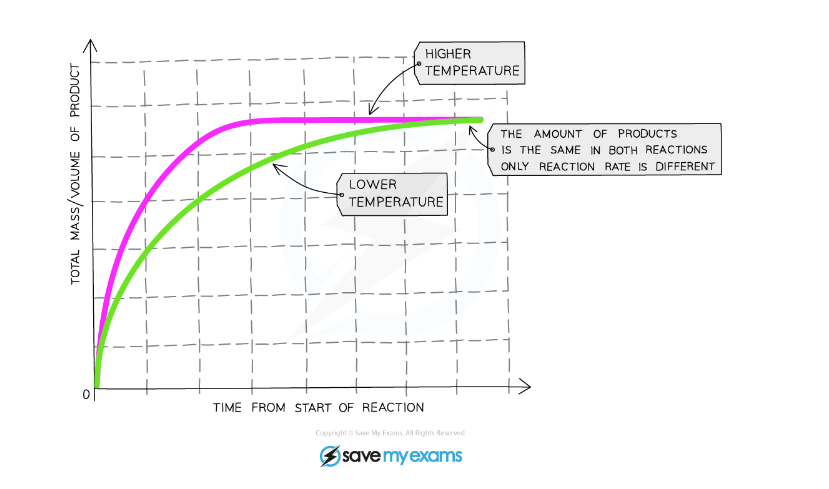
Graph showing the effect of temperature on the rate of reaction
Explanation:
- Compared to a reaction at a low temperature, the graph line for the same reaction but at a higher temperature has a steeper gradient at the start and becomes horizontal sooner
- This shows that with increased temperature, the rate of reaction will increase
Surface Area
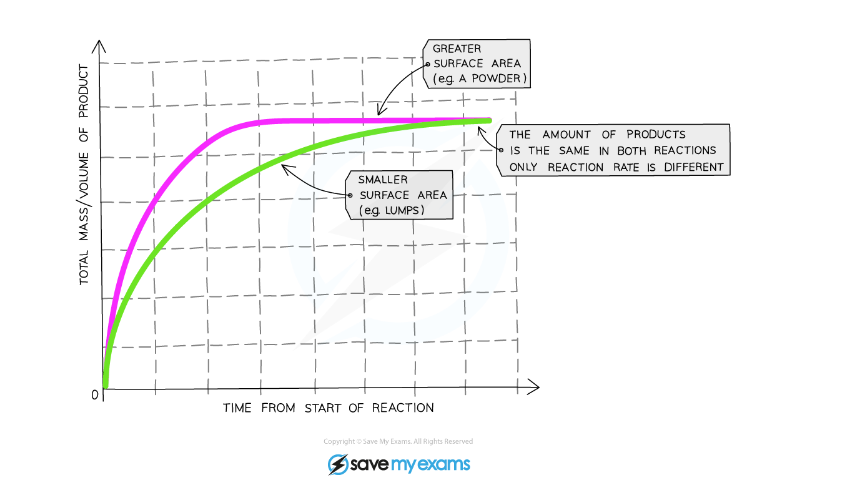 Graph showing the effect of increased surface area on a reaction rate
Explanation:
- Compared to a reaction with lumps of reactant, the graph line for the same reaction but with powdered reactant has a steeper gradient at the start and becomes horizontal sooner
- This shows that with increased surface area of the solid, the rate of reaction will increase
Surface Area and Particle Size
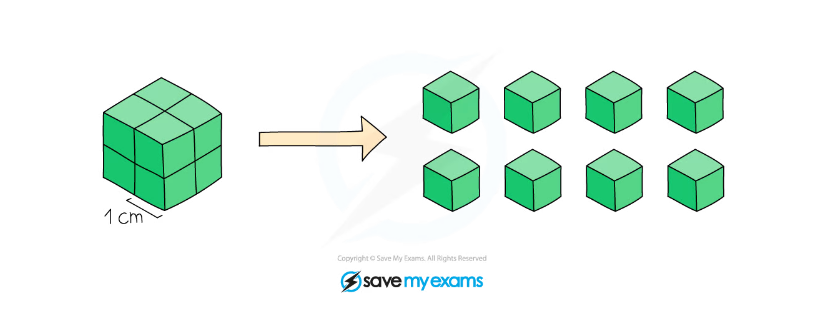
Diagram showing that surface area increase as particle size decreases. A 2 cm3 cube has a surface area of 24 cm2 and the same cube cut up into 8 cubes has a surface area of 48 cm2
Effect of a Catalyst
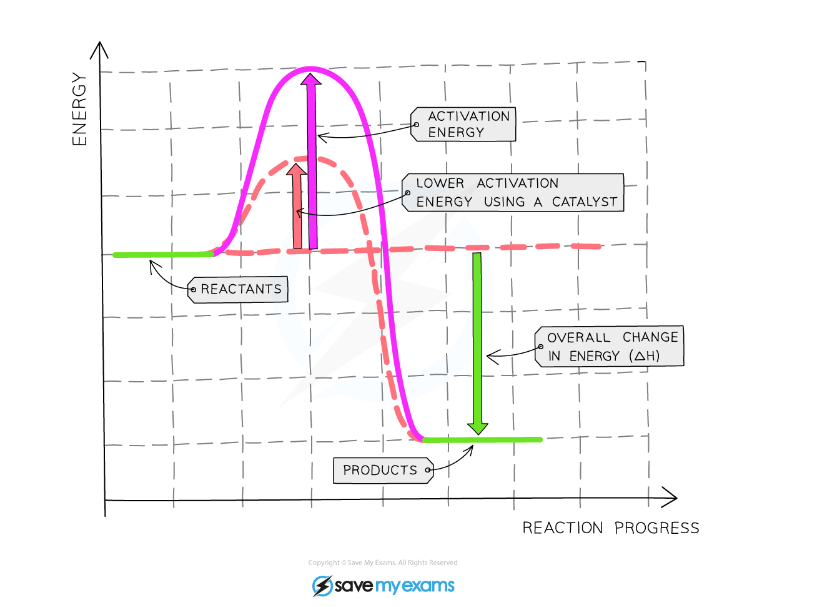 Graph showing the effect of using a catalyst on the activation energy of a reaction
Explanation:
- The diagram shows that when a catalyst is used, the activation energy is reduced as it creates an alternative pathway requiring lower activation energy
- Lowering the activation energy means more particles will have enough energy to react when they come together
- This shows that when a catalyst is used, the rate of reaction will increase
Exam Tip
You should be able to recall how changing the concentration, pressure, temperature, surface area and catalysts affect the rate of reactions
转载自savemyexams

早鸟钜惠!翰林2025暑期班课上线

最新发布
© 2025. All Rights Reserved. 沪ICP备2023009024号-1


