- 翰林提供学术活动、国际课程、科研项目一站式留学背景提升服务!
- 400 888 0080
Edexcel A Level Maths: Statistics:复习笔记6.1 Large Data Set
Using a Large Data Set
What is a large data set?
- As part of your course there is a large data set that you can use
- It contains lots of information
- You are not expected to memorise any results from the data
- You will have an advantage if you are familiar with the large data set
- Understand what the variables are
- Understand the terminology used
- Understand the context
- You will not get a copy of the large data set in your exam
- if you are required to calculate anything using the large data set you will be given an extract within the question
What skills can I practice with a large data set?
- Cleaning data
- There might be missing data
- You could identify outliers and question their validity
- Sampling and hypothesis testing
- You can practice different methods of sampling using the data
- You could use a sample to test a hypothesis
- Statistical measures and diagram
- You could calculate summary statistics for different variables
- You could create different diagrams
- You can interpret the summary statistics and diagrams (as it is real data you could explore the context behind the results)
- You could compare summary statistics and diagrams
Do I have to use spreadsheets and other technology?
- You will not be assessed on using spreadsheets
- However, it is a useful skill for your future career
- You could use technology to calculate the summary statistics and create the statistical diagrams
- This will help you to practice these skills whilst using real data
- Spreadsheets can calculate summary statistics
- In the exam you could use the statistics mode on your calculator
Summary of the Large Data Set
What is the data about?
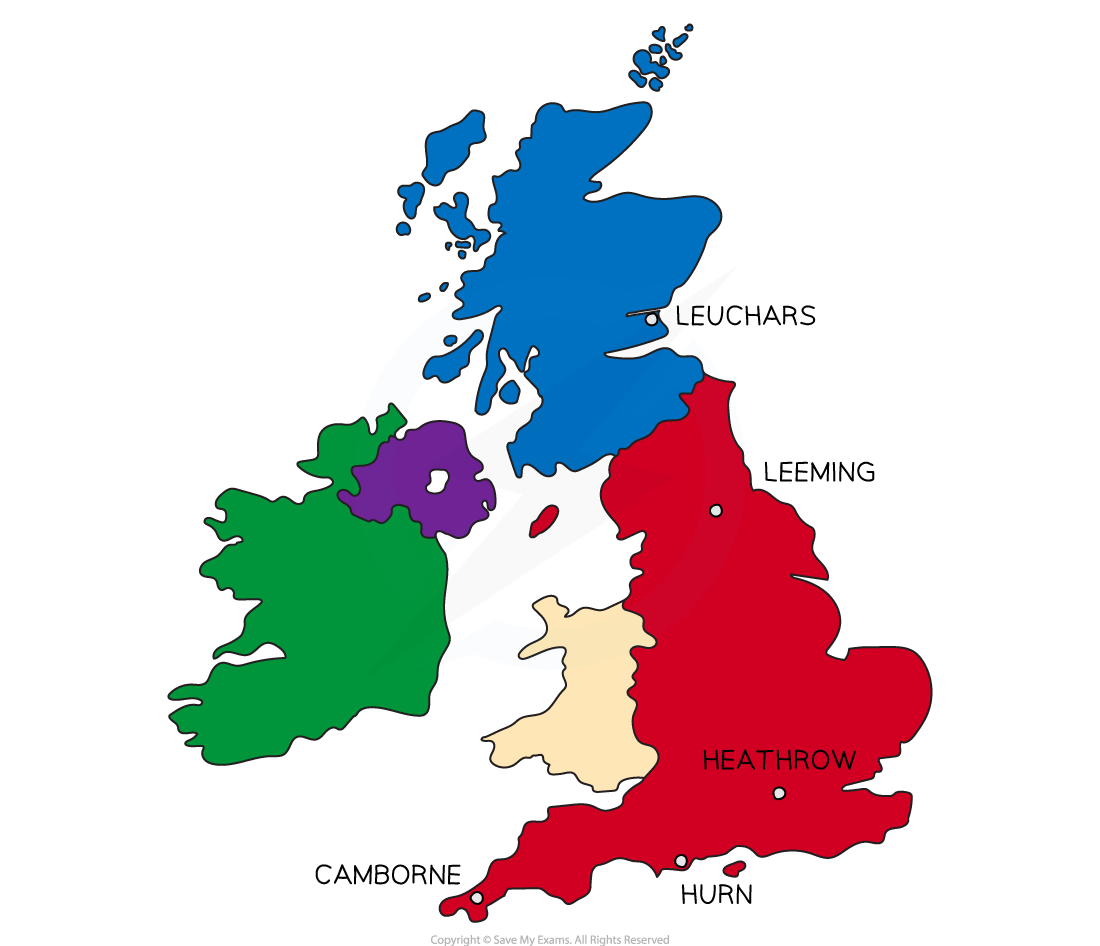
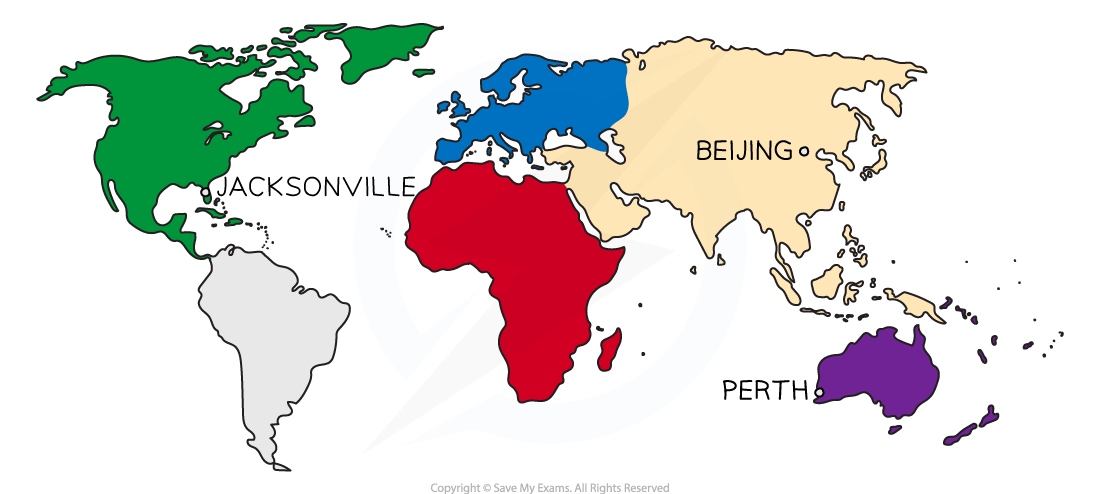
- The data consists of samples of data on the weather for eight locations over two different time periods
- The five UK locations are:
- Leuchars: town in Scotland
- Leeming: village in North Yorkshire
- Heathrow: hamlet in Greater London
- Hurn: village in Dorest (South West England)
- Camborne: town in Cornwall (South West England)
- The three international locations are:
- Beijing: capital city of China
- Perth: capital city of Western Australia (state of Australia)
- Jacksonville: city in Florida (state of USA)
- The two time periods are:
- May to October 1987
- May to October 2015


What variables are included in the large data set?
- Daily mean (air) temperature
- Measured in degrees Celsius (°C) given to 1dp
- Average of hourly temperature readings between 0900 - 0900 GMT
- Daily total rainfall
- Measured in millimetres (mm) given to 1dp
- Measured for the 24 hours starting at 0900 GMT
- A trace of rain 'tr' is an amount less than 0.05mm
- Daily total sunshine
- Measured in hours (hr) given to 1dp
- Daily maximum relative humidity
- Given as a percentage given to the nearest integer
- A reading above 95% is associated with mist and fog
- Daily mean windspeed and direction
- Mean measured in knots (1 kn = 1.15 mph) given to nearest integer and is described using the Beaufort conversion (calm, light, etc)
- Direction measured in degrees rounded to the nearest 10 and is given as a cardinal direction (north, south, etc)
- Averaged for 24 hours starting at 0000 GMT
- Daily maximum gust and direction
- Measured using the same units as windspeed
- The maximum instantaneous speed over the 24 hours
- Cloud cover
- Measured in Oktas (eighths of the sky covered by cloud)
- Daily mean visibility
- Measured in decametres (1 Dm = 10 m) horizontally
- Daily mean pressure
- Measured in hectopascals (1 hPa = 100 Pa = 1 millibar)
Is the data complete?
- There are missing or unknown pieces of data
- These are listed as 'n/a' or '-'
- The total daily total sunshine, mean windspeed and maximum gust is unknown for the first half of May 1987 for the UK cities
- The data should be cleaned before samples are taken
- The three international cities only contain date for:
- Daily mean temperature, daily total rainfall, daily mean pressure and daily mean windspeed
What are some of the important features?
- Consider which locations are closer to the equator
- Consider which locations are near a coast
- Jacksonville, Perth, Camborne, Hurn, Leuchars are near the coast
- Consider which locations are in each hemisphere
- Perth is in the southern hemisphere so have winter when UK has summer
- Consider which variables are discrete and which are continuous
- Cloud cover is discrete
- You can use 0 or 0.025 for rainfall that is listed as 'tr'
- The great storm of 1987 happened 15-16 October in UK
- The wind speeds were high at this time
- The south of England was affected
- This will skew some variables (wind/gust/rainfall)
- This won't have much impact some variables (sunshine/cloud cover)
- October in the UK is normally cloudy and have less sunshine
- Don't worry about remembering the exact dates of this but it is something to be aware of
- Consider the number of days in each month
- 30 days in June and September
- 31 days in May, July, August and October
- In total the LDS covers 184 days
Worked Example
Using the large data set, Dylan collects data on the daily total sunshine in Leuchars from May to October 1987 by taking a random sample of 30 days.
(a) Using your knowledge of the large data set, explain why Dylan will have to first clean the data before taking a sample.
(b) Dylan calculates the mean value from his sample to be 25.3 hours. Using your knowledge of the large data set, explain how you know Dylan has made a mistake.
(a) Using your knowledge of the large data set, explain why Dylan will have to first clean the data before taking a sample.

(b) Dylan calculates the mean value from his sample to be 25.3 hours. Using your knowledge of the large data set, explain how you know Dylan has made a mistake.

转载自savemyexams

最新发布
© 2025. All Rights Reserved. 沪ICP备2023009024号-1


