- 翰林提供学术活动、国际课程、科研项目一站式留学背景提升服务!
- 400 888 0080
Edexcel A Level Maths: Statistics:复习笔记3.2.2 Further Venn Diagrams
Further Venn Diagrams
What do you mean by further Venn diagrams?
- The Venn diagrams used here are no more complicated than those in the first Venn Diagrams revision note, however
- Venn diagrams, and the wording/terminology in questions, may now involve the use of set notation including the symbols ∪(union),
∩(intersection), ‘ (complement) and | (“given that”) - Conditional probability problems can be solved using Venn diagrams
- Venn diagrams, and the wording/terminology in questions, may now involve the use of set notation including the symbols ∪(union),
How do I solve conditional probability problems using Venn diagrams?
- Interpreting questions in terms of AND (∪), OR (∩), complement ( ‘ ) and
“given that” ( | ) - Conditional probability may now be involved too
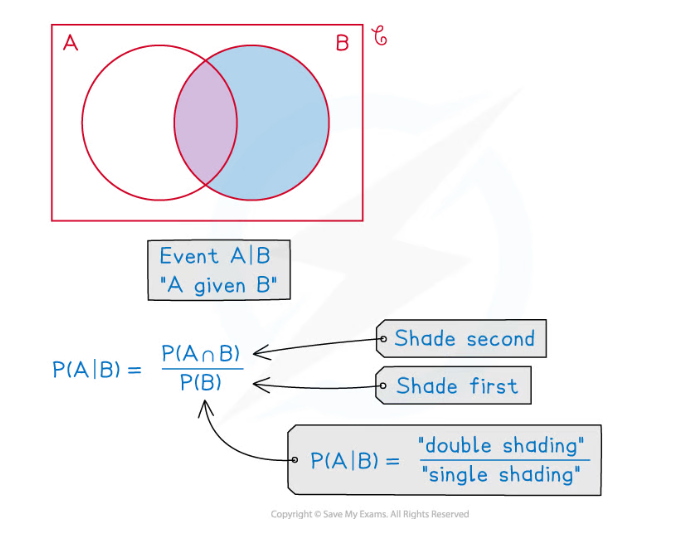
- Use mini-Venn diagrams to sketch and shade the regions you are dealing with – use different colours if available or different styles of shading if not
- Shading can help you see the answer
since  shade B first, then shade
 ![]()
the answer will then be 
Worked Example
Three events, ![]() ,
,![]() and
and ![]() are such that
are such that
events ![]() and
and ![]() are mutually exclusive
are mutually exclusive
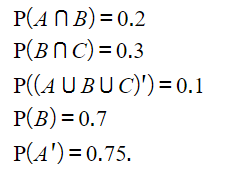
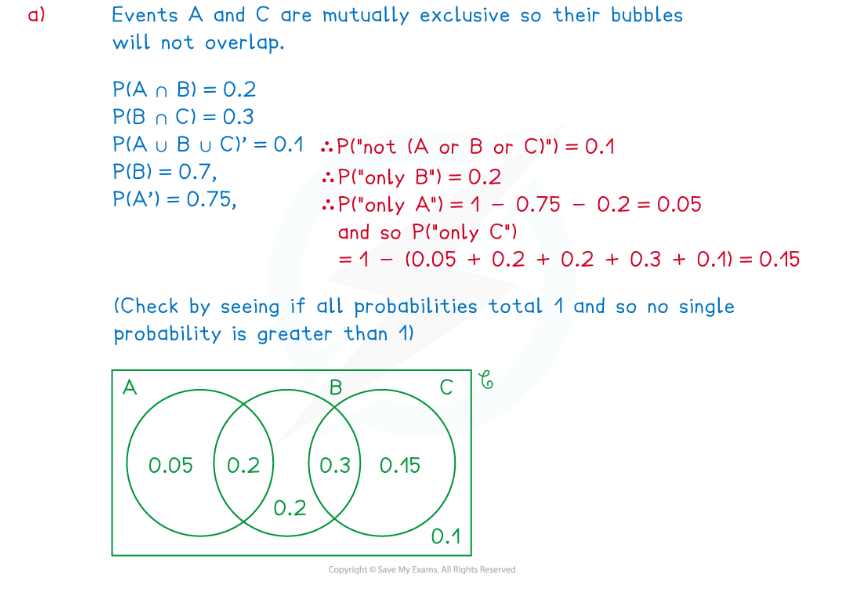
(a) Draw a complete Venn diagram to show the probabilities connecting the three events.
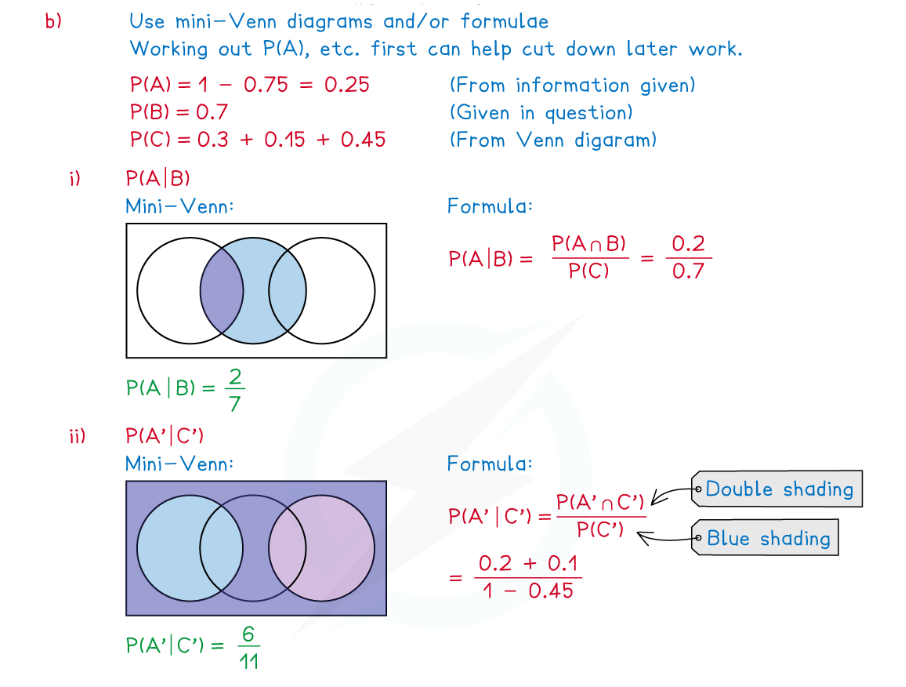
(b) Find

(a) Draw a complete Venn diagram to show the probabilities connecting the three events.
(b) Find

Exam Tip
- Always draw the box in a Venn diagram; it represents all possible outcomes of the experiment so is a crucial part of the diagram, the bubbles merely represent the events we are particularly interested in
- You may be able to answer some questions by applying formulae or you may prefer to use shaded mini-Venn diagrams; complicated questions tend to be easier with mini-Venn diagrams
转载自savemyexams


最新发布
© 2025. All Rights Reserved. 沪ICP备2023009024号-1

