Edexcel A Level Maths: Statistics:复习笔记2.5.1 PMCC & Non-linear Regression

Product Moment Correlation Coefficient (PMCC)
What is the product moment correlation coefficient?
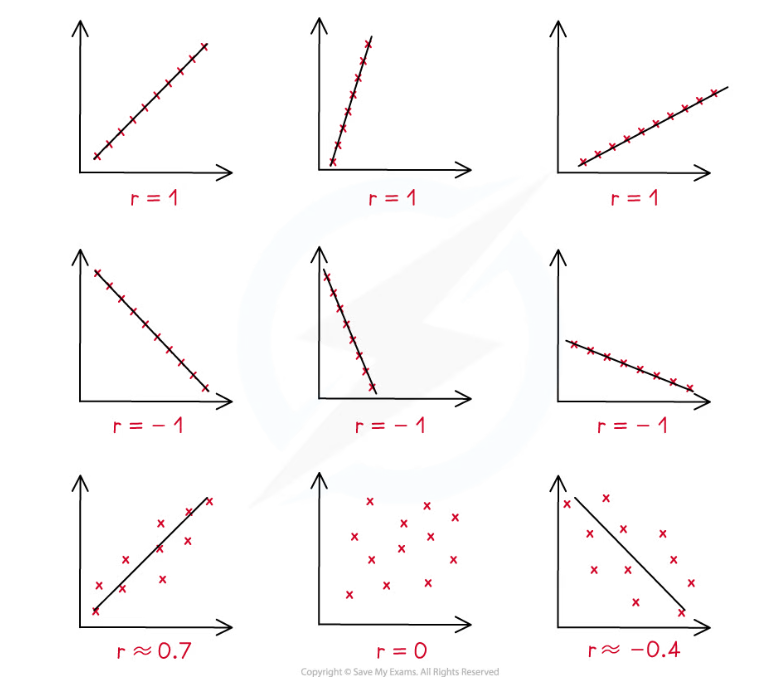
- The product moment correlation coefficient (PMCC) is a way of giving a numerical value to linear correlation of bivariate data
- The PMCC of a sample is denoted by the letter
 can take any value such that
- A positive value of describes positive correlation
- A negative value of describes negative correlation
- If
 there is no correlation
  means perfect positive correlation and
  means perfect negative correlation
- The closer to 1 or -1, the stronger the correlation
- The gradient does not change the value of
How is the product moment correlation coefficient calculated?
- You must learn how to use your calculator to calculate value of the PMCC, for the relationship between two variables
- All calculators are different and you should make sure you can calculate the PMCC on your personal calculator
- Make sure you know how put your calculator into the statistics mode
- You will be given the option to turn the frequency on or off, choose off for most calculations of the PMCC
- With the statistics mode switched on on your calculator, there will be a ‘statistics’ option, followed by a regression option in the form A + BX
- Your calculator will give you two columns into which you can input the
 and
and  data values
- Your calculator will give you two columns into which you can input the
- Once the data has been entered into your calculator, choose the ‘r’ value from the ‘STAT’ options
- Make sure you know how put your calculator into the statistics mode
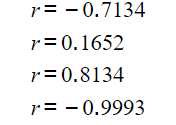
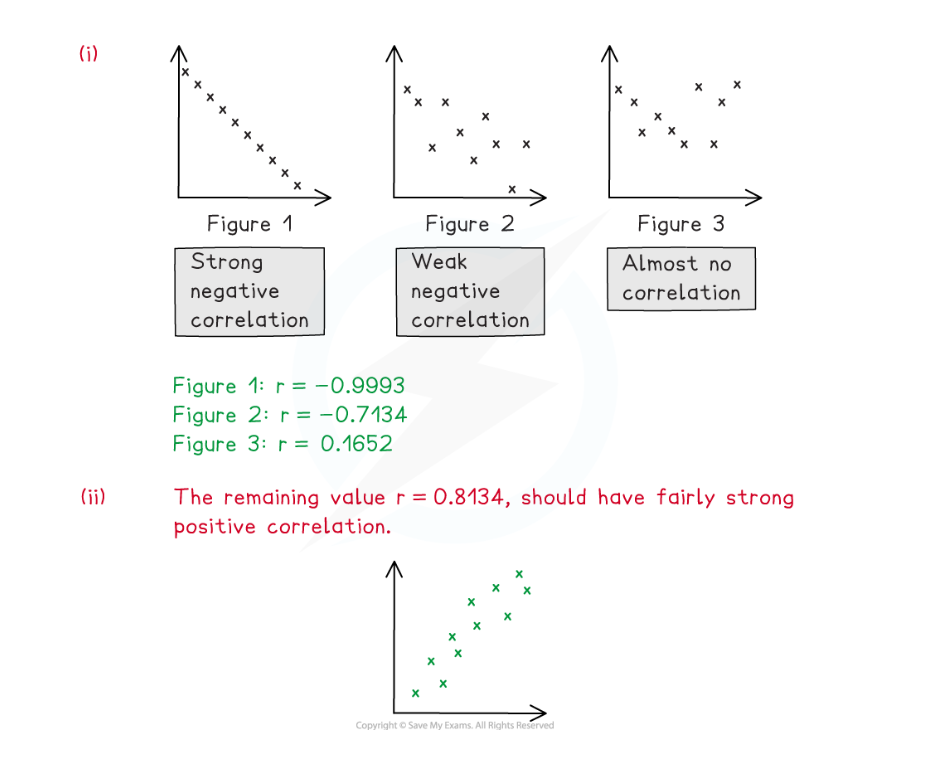
Worked Example
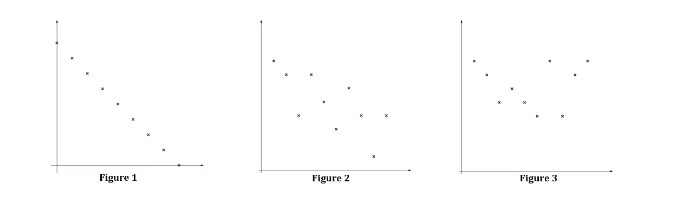
Three scatter diagrams, showing observations from different bivariate data sets, are shown above.
Non-linear Regression
At AS Level you learned how to use linear regression models to describe a relationship between two variables. However, it is possible for two variables to have a relationship that does not fit a linear model, but still shows a pattern based on exponential growth or decay. A linear regression model is only appropriate if the PMCC is close to 1 or -1.
What forms can non – linear regression models take?
- If a bivariate data set appears to have a non – linear relationship it could fit an exponential model
- A non – linear regression model could take the form
 or
or  where a, n, k and b are constants
- A non – linear regression model could take the form
- It is possible to use logarithms to rearrange the non – linear form of the model to obtain a linear regression model which can then be used to examine trends in the data
- If the regression model takes the form the data should be coded from - values to - values using
 and
and 
- If for constants a and n, then

- Plotting
 against
  will give a linear graph
 - The y – intercept would be
 and the gradient of the line would be n
 - This can be shown by taking logarithms of both sides
- If
- If the regression model takes the form
 the data should be coded from values to values using
  and
and 
- If for constants k and b , then

- Plotting against will give a linear graph
- The y – intercept would be
 and the gradient of the line would be
- This can be shown in the same way by taking logarithms of both sides
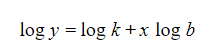
- For example:
- If
- If the regression model takes the form
![]()
Take logarithms of both sides
![]()
Use the addition law for logarithms
![]()
Use the power law for logarithms
- Using logarithms to code the data in this way is called changing the variables
How can non – linear regression models be used?
- Non – linear regression models can be used in much the same way as linear regression models
- By coding the original data using logarithms (changing the variables) a regression line of Y on X can be found
- This can be used to make predictions for data values that are within the range of the given data (interpolation)
- Making a prediction outside of the range of the given data is called extrapolation and should not be done
- The non – linear regression model can then be found by substituting and back into the X and Y values in the regression line and rearranging
Worked Example
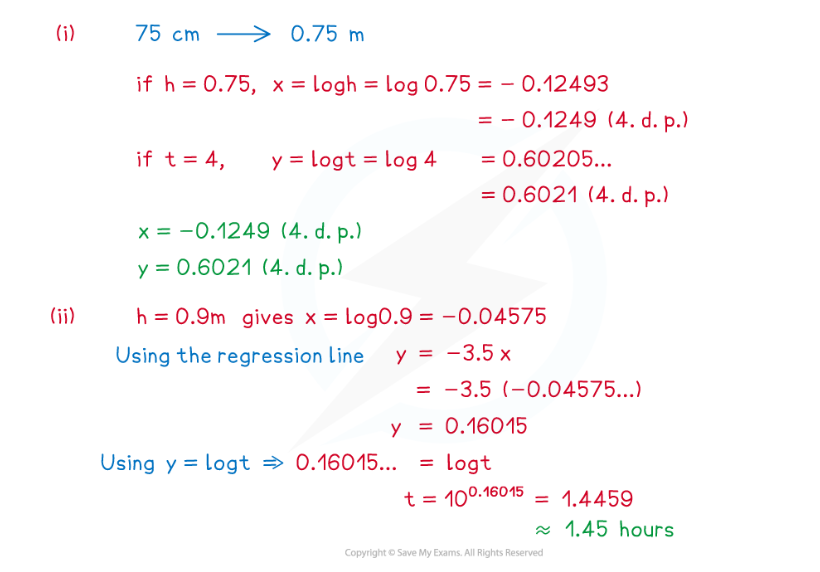
The graph below shows the distribution of the height, ![]() m, of a group of children and the amount of time,
m, of a group of children and the amount of time, ![]() hours, they spend napping in the day. It is believed the data can be modelled using the form
hours, they spend napping in the day. It is believed the data can be modelled using the form ![]() .
.

The data are coded using the changes of variables ![]() and
and ![]() . The regression line of
. The regression line of ![]() on
on ![]() is found to be
is found to be ![]() .
.
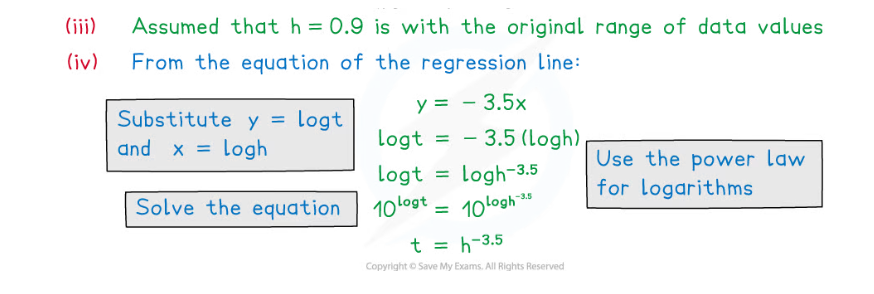
Exam Tip
- Be careful when using original and coded data interchangeably, it is easy to forget which one you are working with. Remember that if your regression line was calculated using coded data then you will need to reverse this if finding predictions. Make sure that you are familiar with using logarithms, indices and their laws. Be careful to check which base logarithms were used for coding the data, if was used then it is reversed using
 , but is
  was used then it should be reversed using
  .
.
转载自savemyexams

国际竞赛真题资料-点击免费领取!


美高学分项目重磅来袭!立即了解