Edexcel A Level Maths: Statistics:复习笔记2.1.1 Basic Statistical Measures

Mean, Mode, Median
What are mean, median and mode?
- Mean, median and mode are measures of location
- A measure of location gives information about where data is in the number system
- Mean, median and mode are measures of central tendency
- They describe where the centre of the data is
- They are all types of averages
- In Statistics it is important to be specific about which average you are referring to
How are mean, median and mode calculated?
- You should already be familiar with finding the mean, median and mode from raw, ungrouped data
- The mode is the value that occurs most often in a data set
- In a frequency table the group or class that occurs most often will be referred to as the modal class
- A data set with more than one mode is bimodal
- The median is the middle value when the data is in order of size
- If there are two values in the middle of the data set, the median is the midpoint of the two values
- If finding median from a frequency table find the cumulative frequency first and find the group or class where the middle value will lie
- You may have to use linear interpolation when finding the median from a grouped frequency table
- The mean is the sum of all the values divided by the number of values in the data set
What are summary statistics and their notation?
- Summary statistics are information that summarises a set of data values
- For
 items in a data set:
- The sum of the data is represented by
-
-
- This is usually written
 and reads as ‘sigma x’
- This is usually written
-
-
- The mean of the data is represented by
-
-
- This reads as ‘x bar’
-
- You will come across more summary statistics later in the course
How do we choose the best measure of central tendency?
- It is often better to use one of the averages over the others, depending on the data set
- It’s a good idea to be aware of the advantages and disadvantages of the use of each average
- The mean uses all of the data values, this is good for a large data set where all of the values are close together, but also means that the mean can be affected by extreme values
- The median is not affected by very high or low values so is a good average to use in data sets with extreme values
- The mode is very useful in a lot of practical situations, however often there may be more than one mode, no mode or even a mode that is nowhere near the middle of the data set
Worked Example
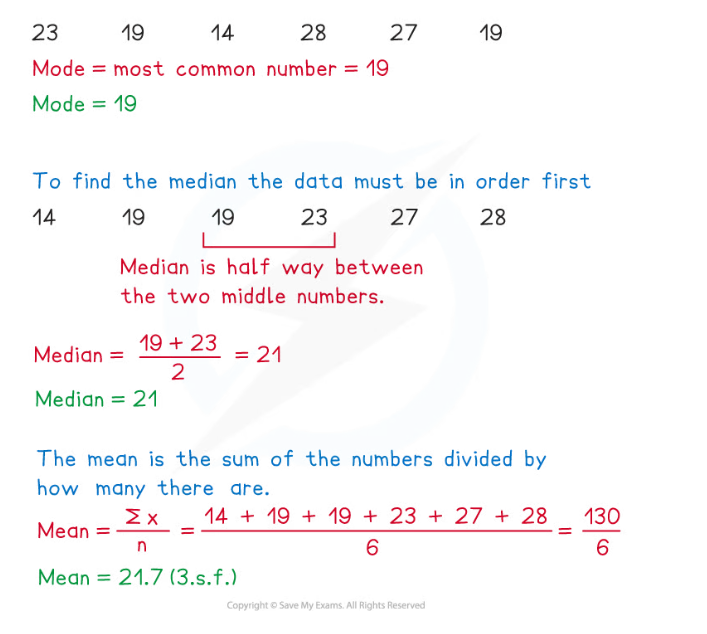
For the data set given below, find the mode, median and mean.
23 19 14 28 27 19
Quartiles & Range
What are quartiles and percentiles?
- Quartiles and percentiles are measures of location
- Quartiles divide a population or data set into four equal sections
- The lower quartile,
 , splits the lowest 25% from the highest 75%
 - The median,
 , is the value that is 50% of the way through the data
 - The upper quartile,
 , splits the lowest 75% from the highest 25%
- The lower quartile,
- Percentiles divide the data into 100 parts
- The 70th percentile lies seven-tenths of the way through the data
- 70% of the data is below it and 30% is above it
- The 70th percentile lies seven-tenths of the way through the data
How are quartiles calculated?
- For a data set of size, ,
- To find the lower quartile, calculate

- If is an integer then the lower quartile is the midpoint of the corresponding value and the one above it
- If is not an integer then the lower quartile is the value corresponding to the next integer up
- If
- To find the upper quartile, calculate

- If is an integer then the upper quartile is the midpoint of the corresponding value and the one above it
- If is not an integer then the upper quartile is the value corresponding to the next integer up
- If
- To find the lower quartile, calculate
- You can also use your calculator to find the quartiles, make sure you know how to put your calculator into STAT mode, enter the data and find the values of Q1, Q2 and Q3
- You could be expected to be able to do this in the exam
What are the range and interquartile range?
- The range and interquartile range are both measures of spread
- A measure of spread gives information about how spread out the data set is
- The range is the difference between the largest and smallest values in the data set
- All data points in the set will be included in the range, including extreme values
- The interquartile range is the difference between the upper quartile and the lower quartile
- Only the middle 50% of the data is included in the interquartile range
- It is not affected by extreme values
- Sometimes an interpercentile range could be asked for, this is the difference between two given percentiles
- For example, the 20th to 80th interpercentile range would be the difference between the 80th percentile and the 20th percentile
- The units for range and interquartile range are the same as the units for the original data
Worked Example
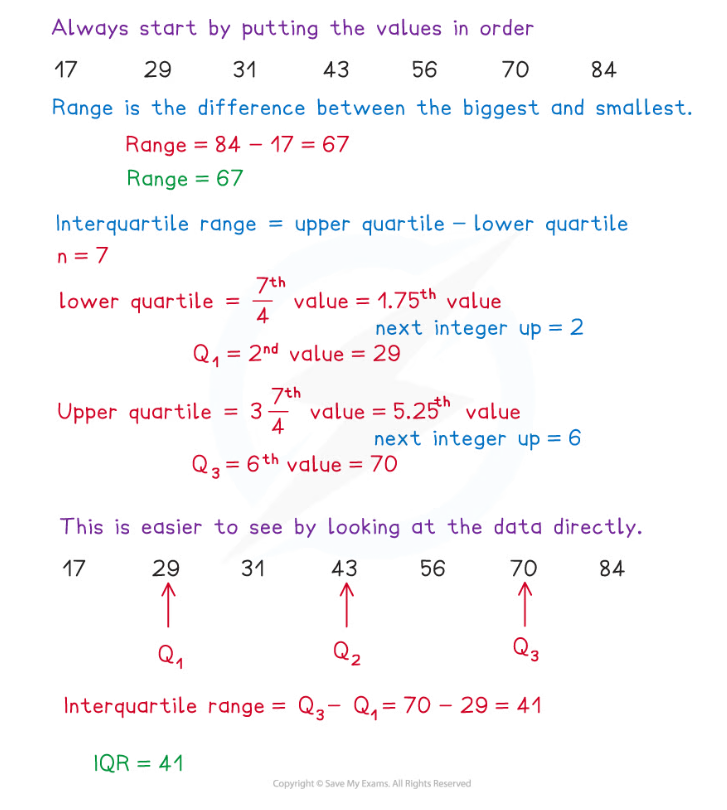
Find the range and interquartile range for the data set given below
43 29 70 31 84 56 17
Exam Tip
- Be aware of the difference between averages and ranges, especially when answering contextual questions asking you to describe or compare data. Remember, averages give an indication of where the data are whilst range gives an indication of how varied the data are.
转载自savemyexams
以上就是关于【Edexcel A Level Maths: Statistics:复习笔记2.1.1 Basic Statistical Measures】的解答,如需了解学校/赛事/课程动态,可至翰林教育官网获取更多信息。
往期文章阅读推荐:
全网破防!ALevel CIE数学M1疑似错题?经济P2难度飙升?5月6日大考考情分析必看!
A-Level CIE就大规模泄题发布最严处罚!哪些考生必须重考?你的成绩怎么办?


翰林AMC8视频课重磅上线!

国际竞赛真题资源免费领取


