- 翰林提供学术活动、国际课程、科研项目一站式留学背景提升服务!
- 400 888 0080
Edexcel A Level Maths: Pure:复习笔记2.7.2 Reciprocal Graphs - Sketching
Reciprocal Graphs - Sketching
What are reciprocal graphs?
- Reciprocal graphs involve equations with an
 term on the denominator e.g.
- There are two basic reciprocal graphs to know for A level

- The second one of these is always positive

More reciprocal graphs
- You also need to recognise graphs where the numerator is not one

- The sign of a shows which part of the graph the curves are located
- The size of a shows how steep the curves are
- The closer a is to 0 the more L-shaped the curves are

-
- horizontal, y = 0 (x-axis)
- vertical, x = 0 (y-axis)All have two asymptotes
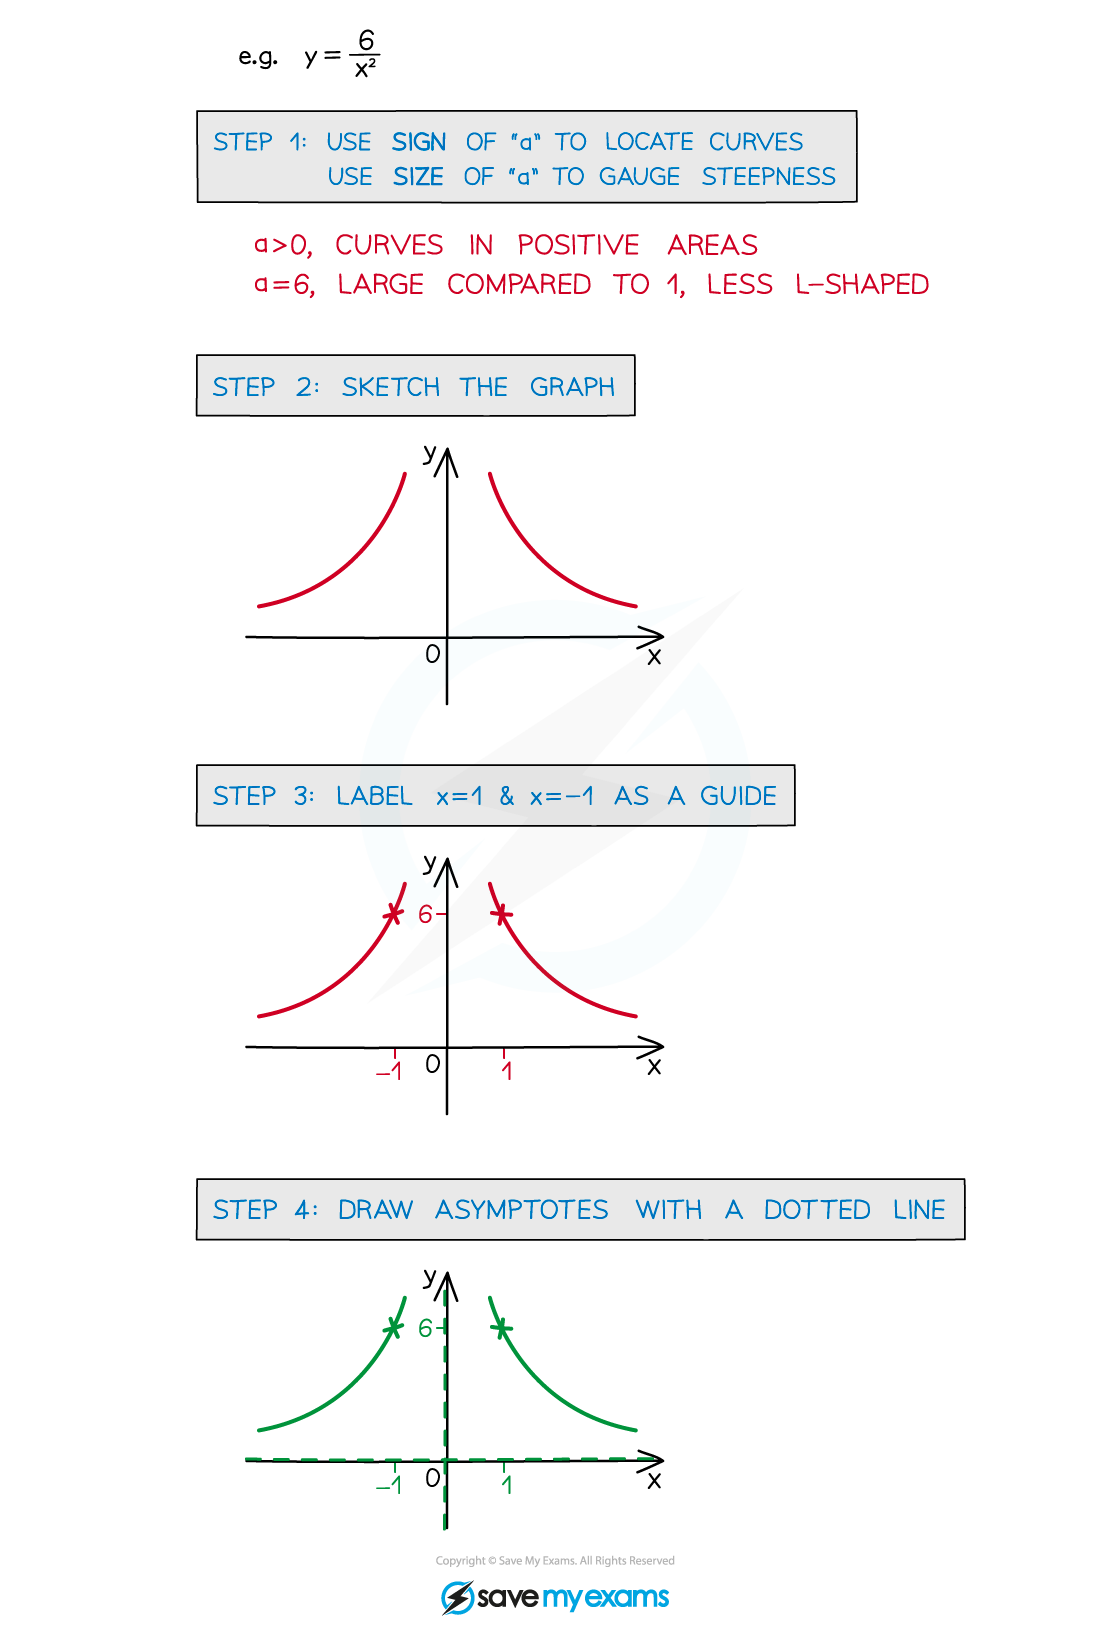
How do I sketch a reciprocal graph?

STEP 1 Use the sign of “a” to locate the curves
and use the size of “a” to gauge the steepness of the curve
STEP 2 Sketch the graph
STEP 3 Label the points x = 1 and x = -1 as a guide to the scale of your graph
STEP 4 Draw asymptotes with a dotted line Draw asymptotes with dotted lines
- These graphs do not intercept either axis
- Graph transformations of them could cross the axes (see Translations)
Worked Example

转载自savemyexams


最新发布
© 2025. All Rights Reserved. 沪ICP备2023009024号-1


