- 翰林提供学术活动、国际课程、科研项目一站式留学背景提升服务!
- 400 888 0080
Edexcel IGCSE Biology: Double Science 复习笔记 Abiotic & Biotic Factors
Edexcel IGCSE Biology: Double Science 复习笔记 Abiotic & Biotic Factors
- In Biology, ‘abiotic’ means non-living
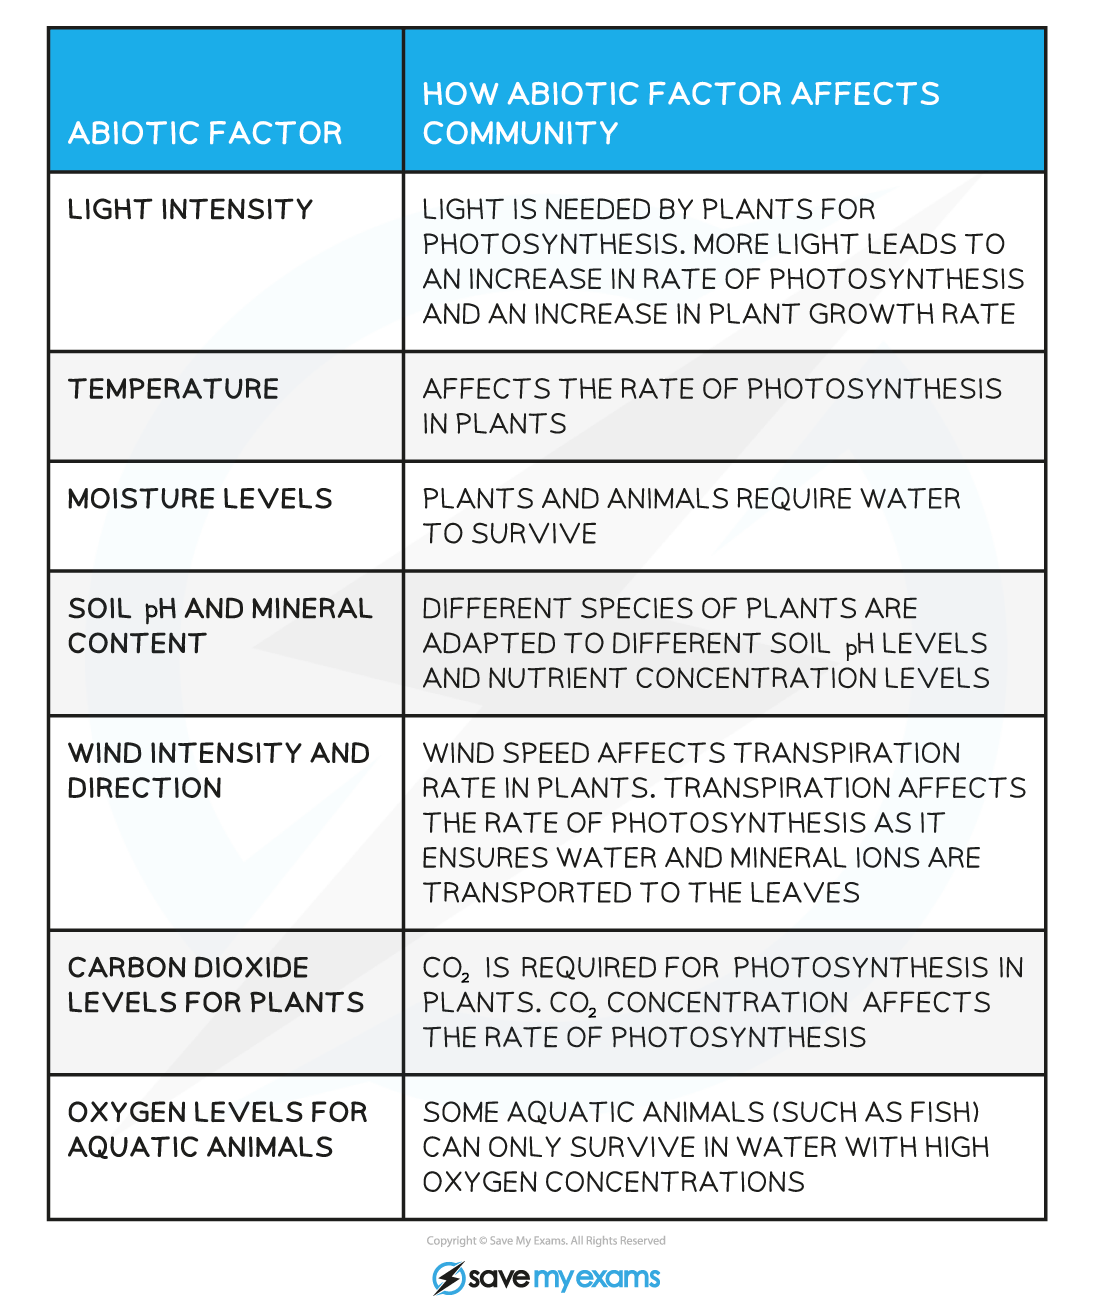
- An abiotic factor is a non-living factor within an environment such as temperature, light intensity and wind speed
Abiotic Factors that affect a Community Table

Effect of abiotic factors
- You should be able to extract and interpret information from charts, graphs and tables relating to the effect of abiotic factors on organisms within a community
Worked Example
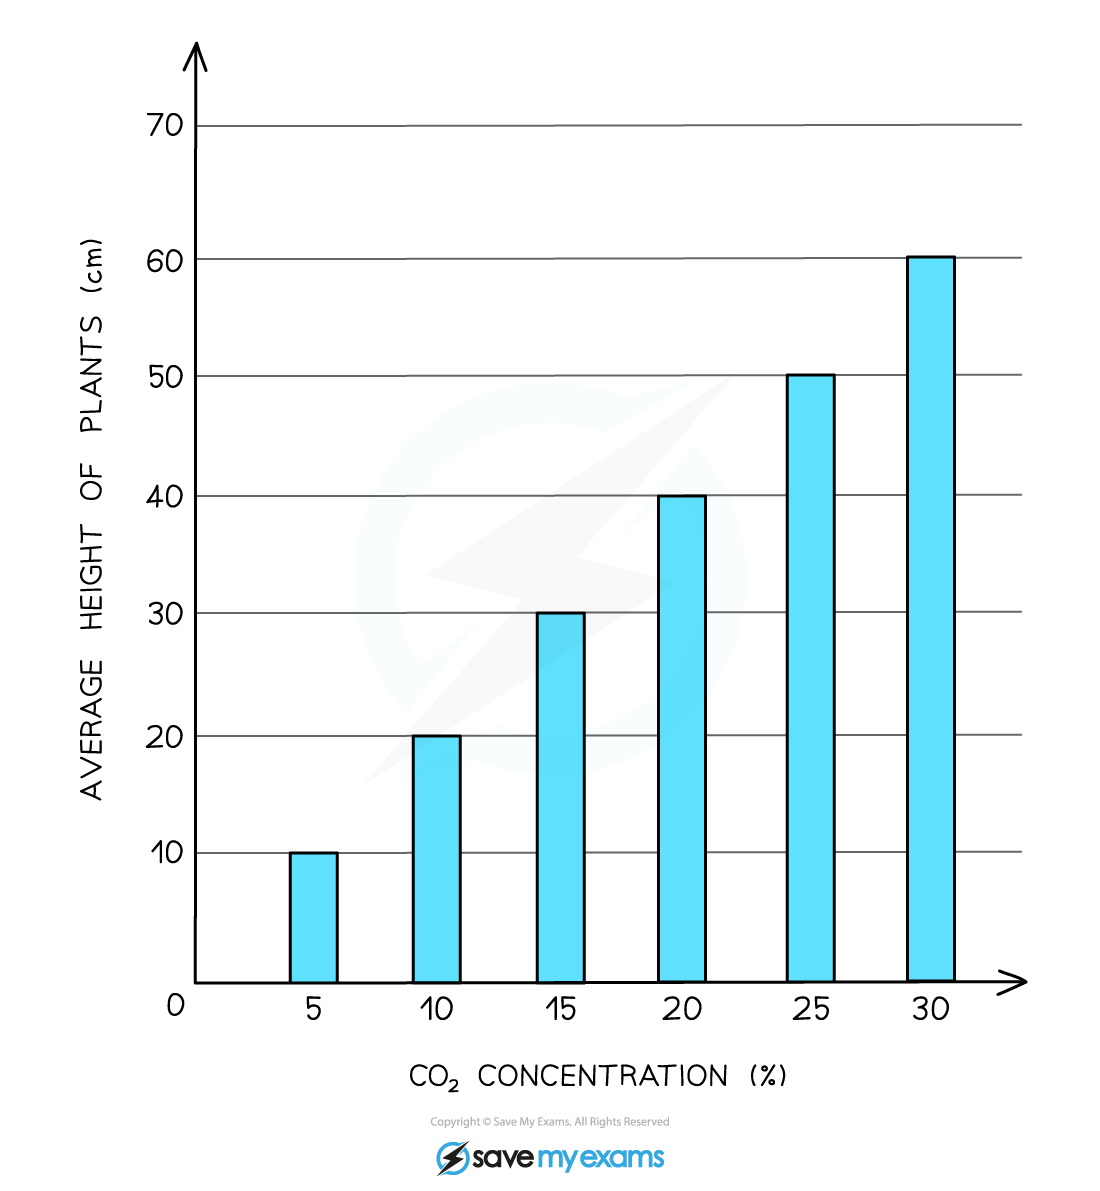
Plants of the same species were grown in tanks with different CO2 levels. Their height was measured after 3 weeks and an average taken. What conclusion can you draw from this graph about the effect of CO2 concentration on plant growth rate? Explain your answer
Example exam answer
As CO2 concentration increases, average plant height also increases. For example, at 5% CO2, the average plant height was 10cm, but at 30% CO2, the average plant height was 60cm. This shows that the higher the CO2 concentration, the greater the plant growth rate. This is because CO2 is used by plants for photosynthesis, which allows the plant to produce glucose for energy to grow.
Biotic factors
- In Biology, ‘biotic’ means living
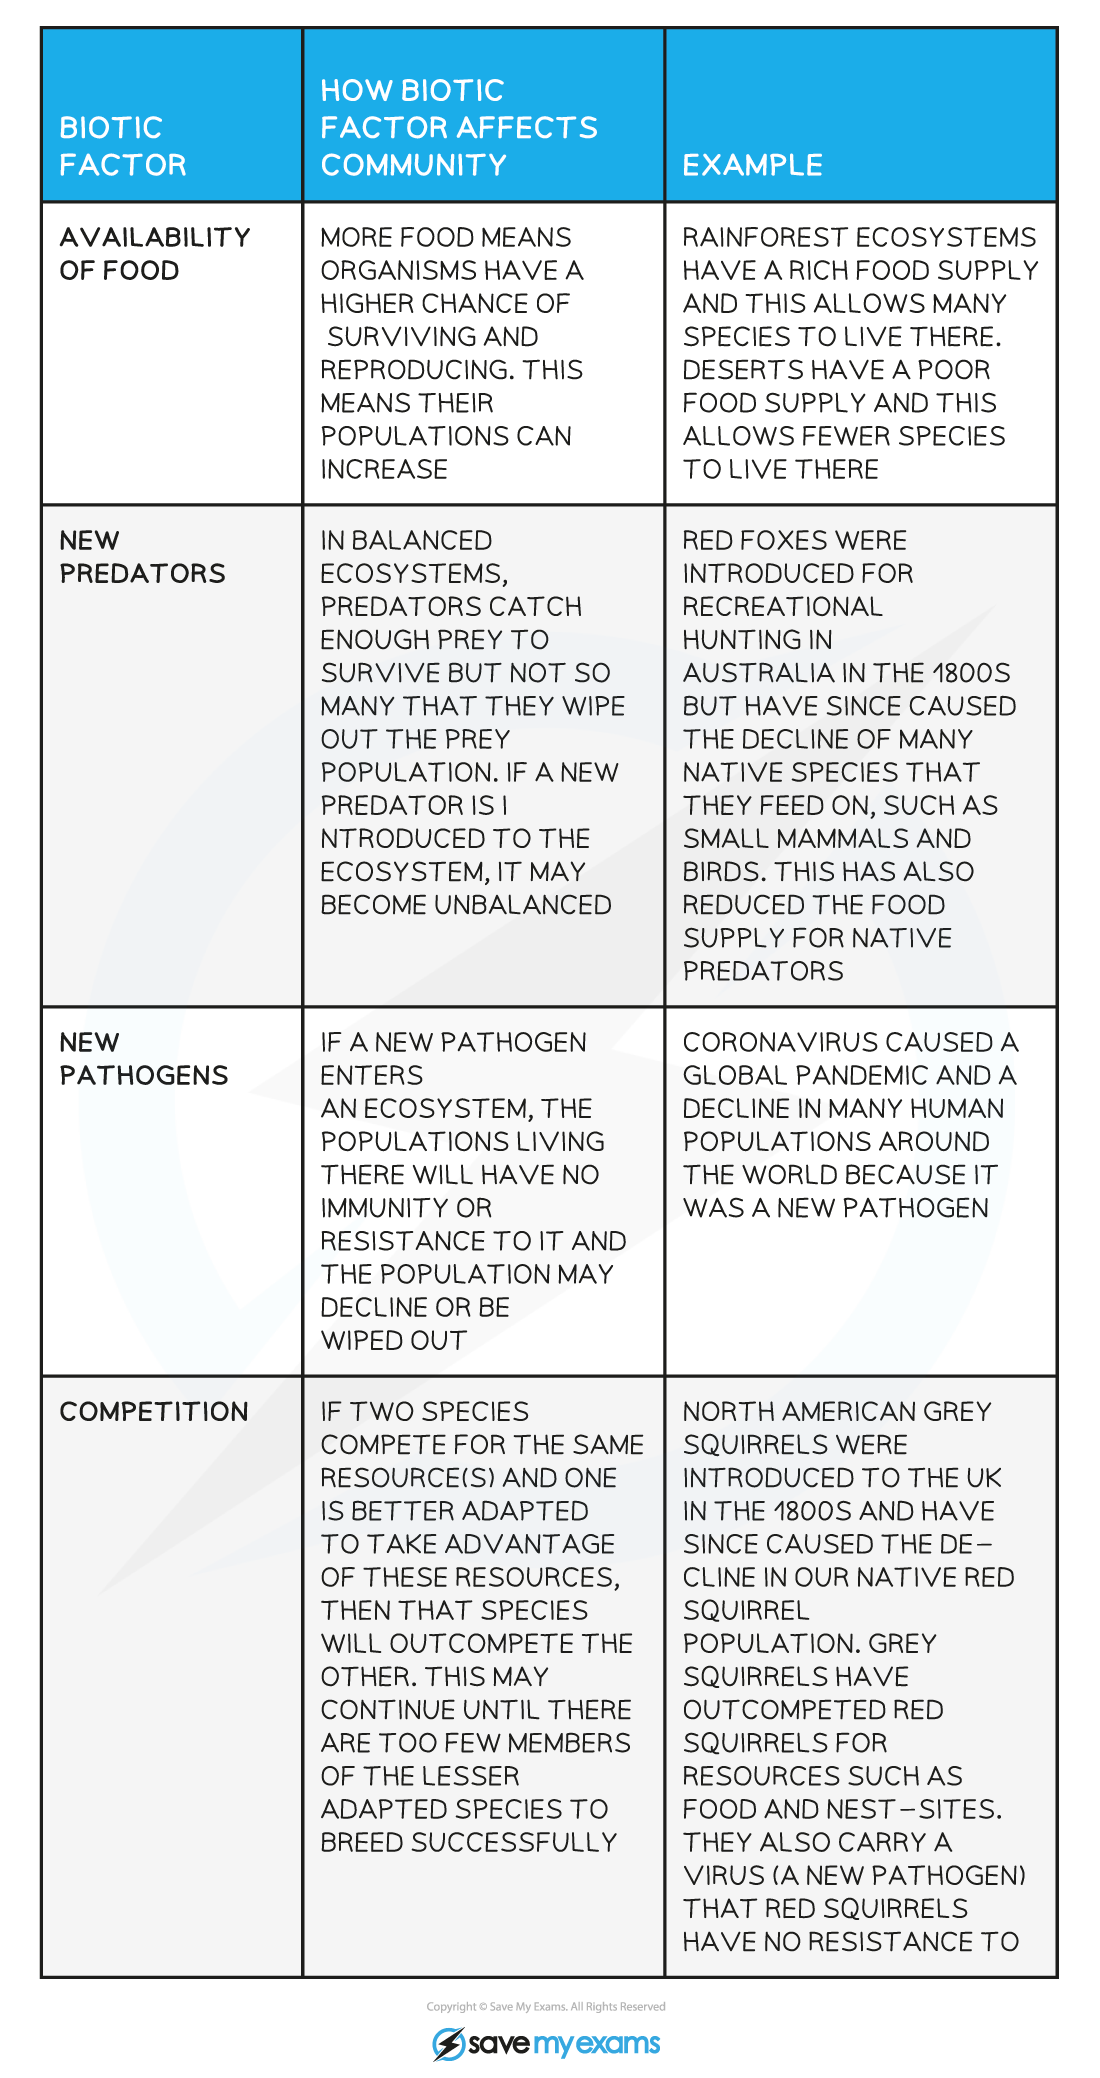
- A biotic factor is a living factor in the environment such as competition, predation and disease
Biotic Factors that affect a Community Table

The effect of biotic factors
- You should be able to extract and interpret information from charts, graphs and tables relating to the effect of biotic factors on organisms within a community
Worked Example
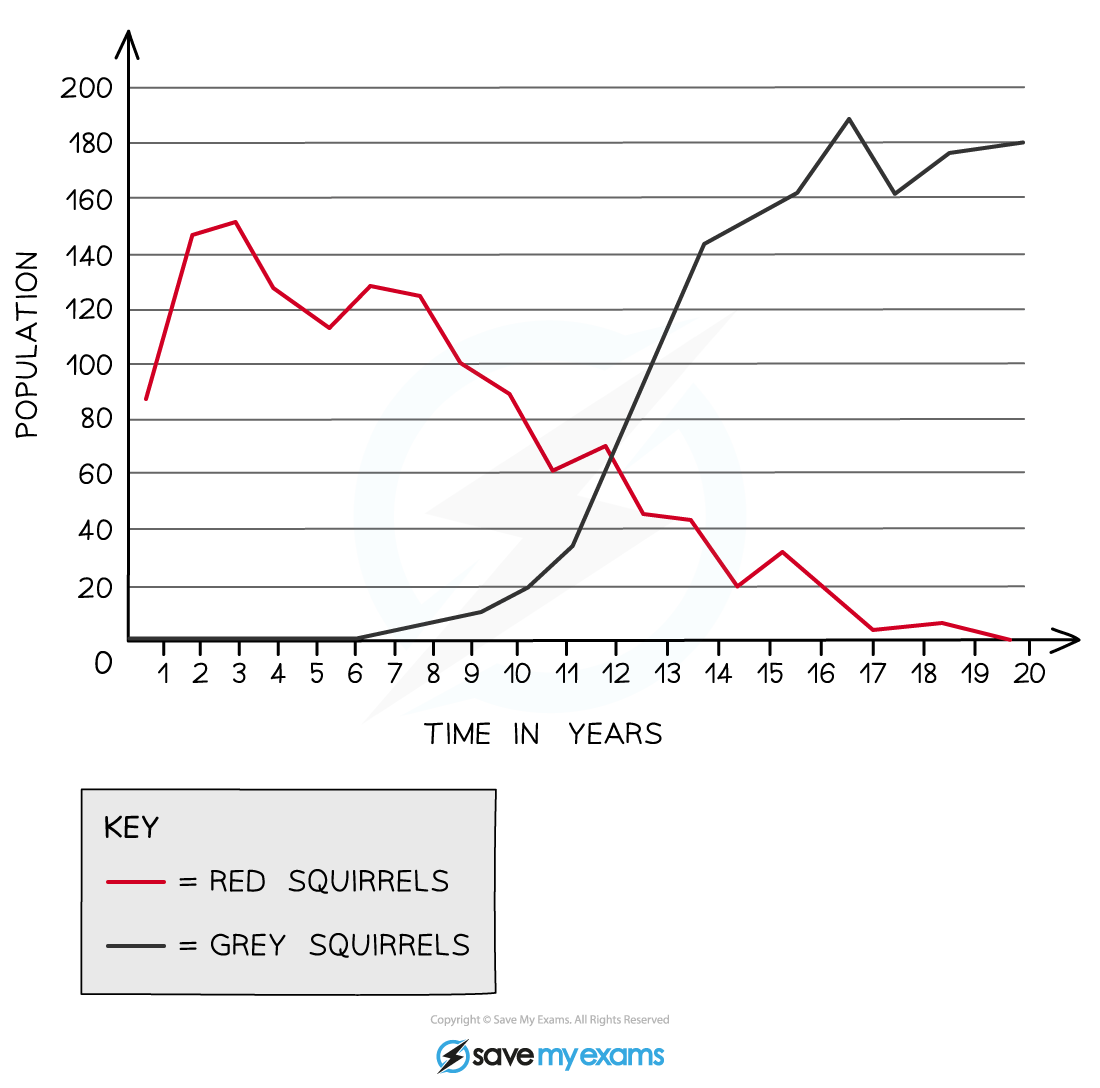
A study recorded the number of red and grey squirrels in a particular woodland habitat for 20 years. Grey squirrels were introduced to the habitat in year 6 of the study.  What conclusion can you draw from this graph about the effect of introducing grey squirrels to a habitat that is occupied by red squirrels? Explain why this might have occurred.
Example exam answer
As the number of grey squirrels increases, the number of red squirrels decreases. This might have occurred because the two squirrel species are competing for one or more of the same resources. Grey squirrels are better adapted to use these resources and have outcompeted the red squirrels until eventually there are too few red squirrels left to breed successfully and there are none left in the habitat.
Exam Tip
When answering questions that refer to a chart, graph or table, remember to reference specific figures from the data to support your answer, as seen in the example above.
转载自savemyexams

最新发布
© 2025. All Rights Reserved. 沪ICP备2023009024号-1


