- 翰林提供学术活动、国际课程、科研项目一站式留学背景提升服务!
- 400 888 0080
Edexcel IGCSE Biology: Double Science 复习笔记 2.5.2 Factors Affecting Photosynthesis
Edexcel IGCSE Biology: Double Science 复习笔记 2.5.2 Factors Affecting Photosynthesis
Limiting Factors
- Plants do not have unlimited supplies of their raw materials so their rate of photosynthesis is limited by whatever factor is the lowest at that time
- So a limiting factor can be defined as something present in the environment in such short supply that it restricts life processes
- There are three main factors that limit the rate of photosynthesis:
- Temperature
- Light intensity
- Carbon dioxide concentration
- Although water is necessary for photosynthesis, it is not considered a limiting factor as the amount needed is relatively small compared to the amount of water transpired from a plant so there is hardly ever a situation where there is not enough water for photosynthesis
- The number of chloroplasts or the amount of chlorophyll in the chloroplasts can also affect the rate of photosynthesis
Temperature
- The temperature of the environment affects how much kinetic energy all particles have – so temperature affects the speed at which carbon dioxide and water move through a plant
- The lower the temperature, the less kinetic energy particles have, resulting in fewer successful collisions occurring over a period of time
- Increasing temperature increases the kinetic energy of particles, increasing the likelihood of collisions between reactants and enzymes which results in the formation of products
- At higher temperatures, however, enzymes that control the processes of photosynthesis can be denatured (where the active site changes shape and is no longer complementary to its substrate) – this reduces the overall rate of photosynthesis
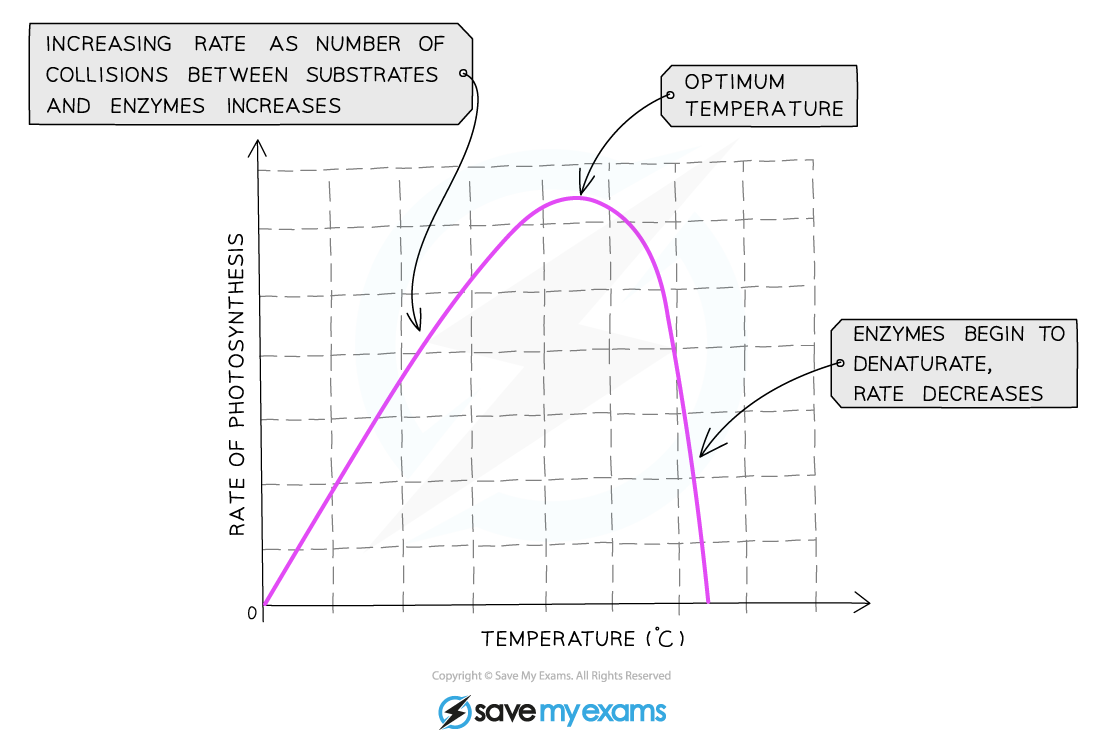
The effect of temperature on the rate of photosynthesis
Light intensity
- The intensity of the light available to the plant will affect the amount of energy that it has to carry out photosynthesis
- The more light a plant receives, the faster the rate of photosynthesis
- This trend will continue until some other factor required for photosynthesis prevents the rate from increasing further because it is now in short supply
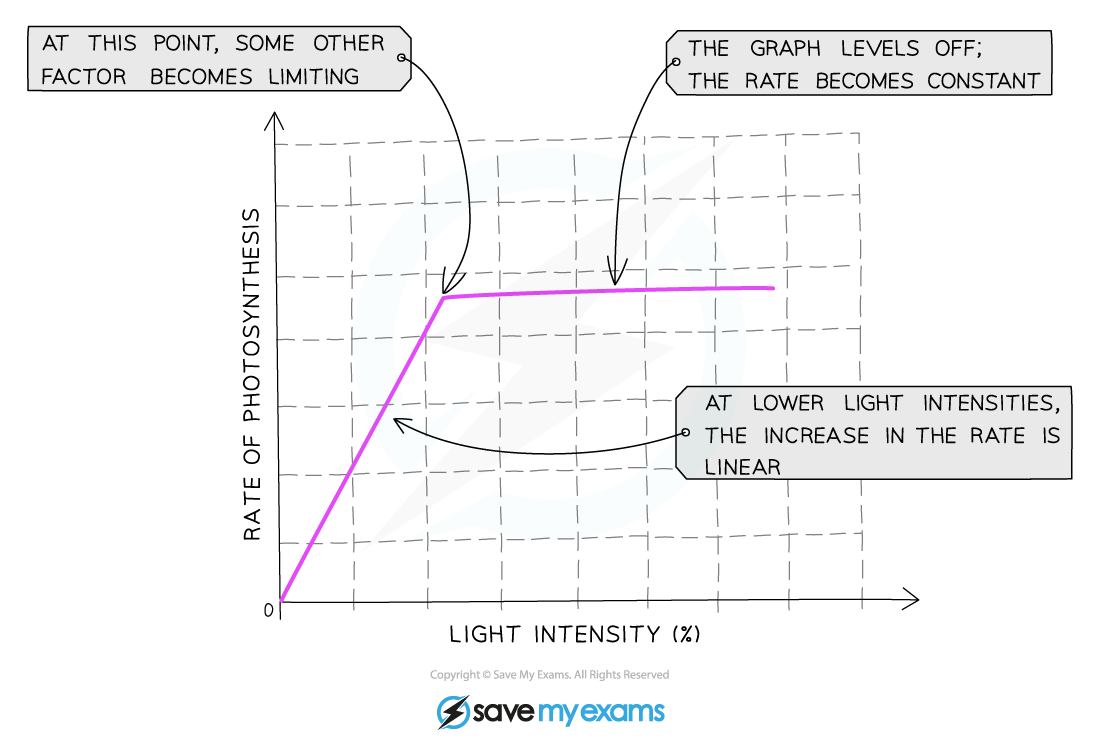
Graph showing the effect of light intensity on the rate of photosynthesis. At low light intensities, increasing the intensity will initially increase the rate of photosynthesis. At a certain point, increasing the light intensity stops increasing the rate. The rate becomes constant regardless of how much light intensity increases as something else is limiting the rate.
Carbon dioxide concentration
- Carbon dioxide is one of the raw materials required for photosynthesis
- This means the more carbon dioxide that is present, the faster the reaction can occur
- This trend will continue until some other factor required for photosynthesis prevents the rate from increasing further because it is now in short supply
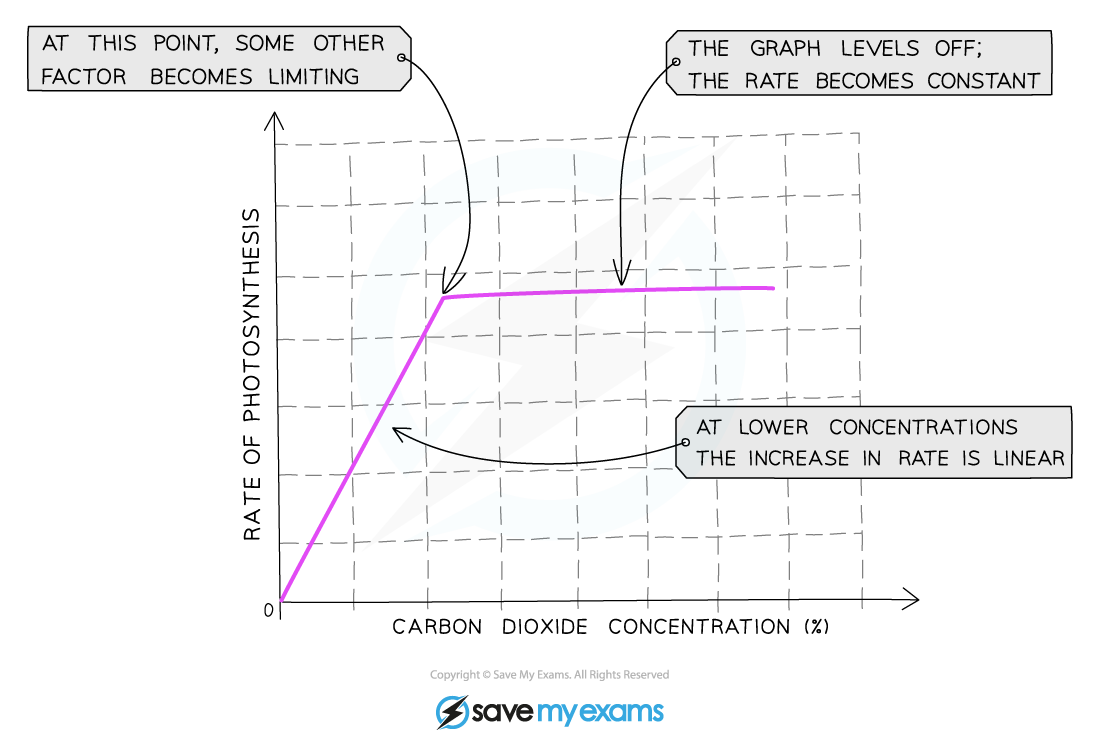
A graph showing the effect of the concentration of carbon dioxide on the rate of photosynthesis
Chlorophyll
- The number of chloroplasts (as they contain the pigment chlorophyll which absorbs light energy for photosynthesis) will affect the rate of photosynthesis
- The more chloroplasts a plant has, the faster the rate of photosynthesis
- The amount of chlorophyll can be affected by:
- Diseases (such as tobacco mosaic virus)
- Lack of nutrients (such as magnesium)
- Loss of leaves (fewer leaves means fewer chloroplasts)
Exam Tip
Interpreting graphs of limiting factors can be confusing for many students, but it’s quite simple. In the section of the graph where the rate is increasing (the line is going up), the limiting factor is whatever the label on the x axis (the bottom axis) of the graph is. In the section of the graph where the rate is not increasing (the line is horizontal), the limiting factor will be something other than what is on the x axis – choose from temperature, light intensity or carbon dioxide concentration.
Leaf Structure
- Plant leaves have complex structures with layers of different tissues containing specially adapted cells
- The table below describes the different structures in a leaf and their functions
Leaf Structures Table
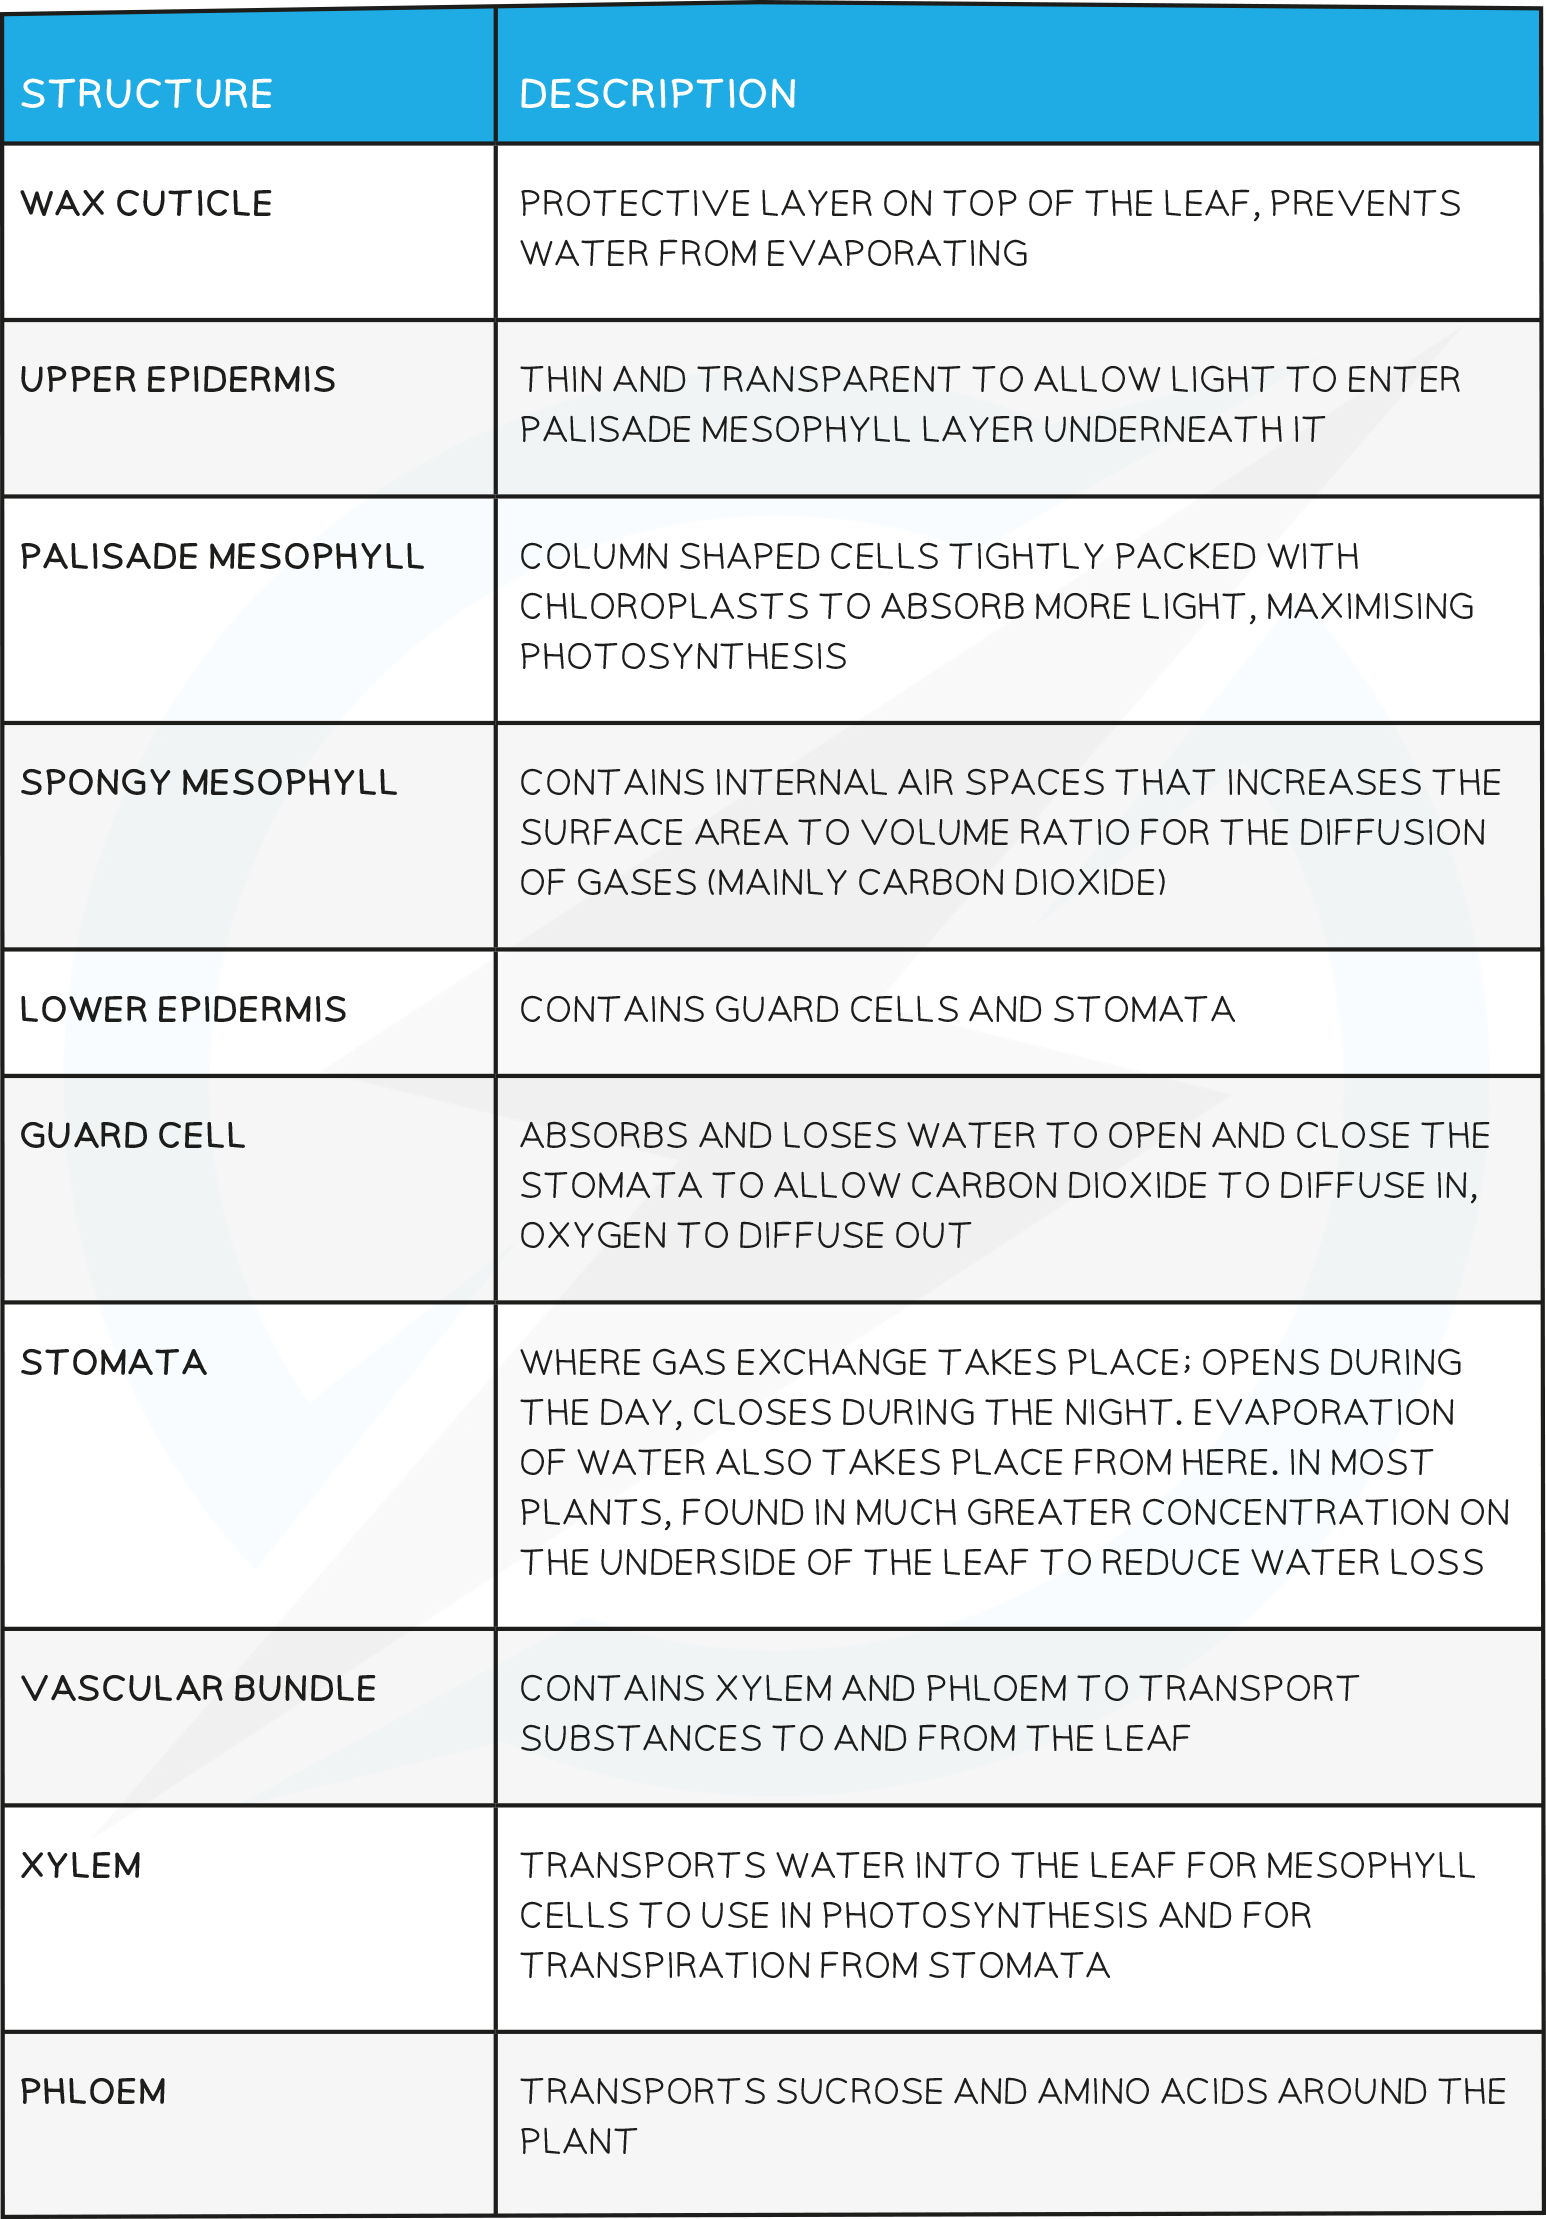
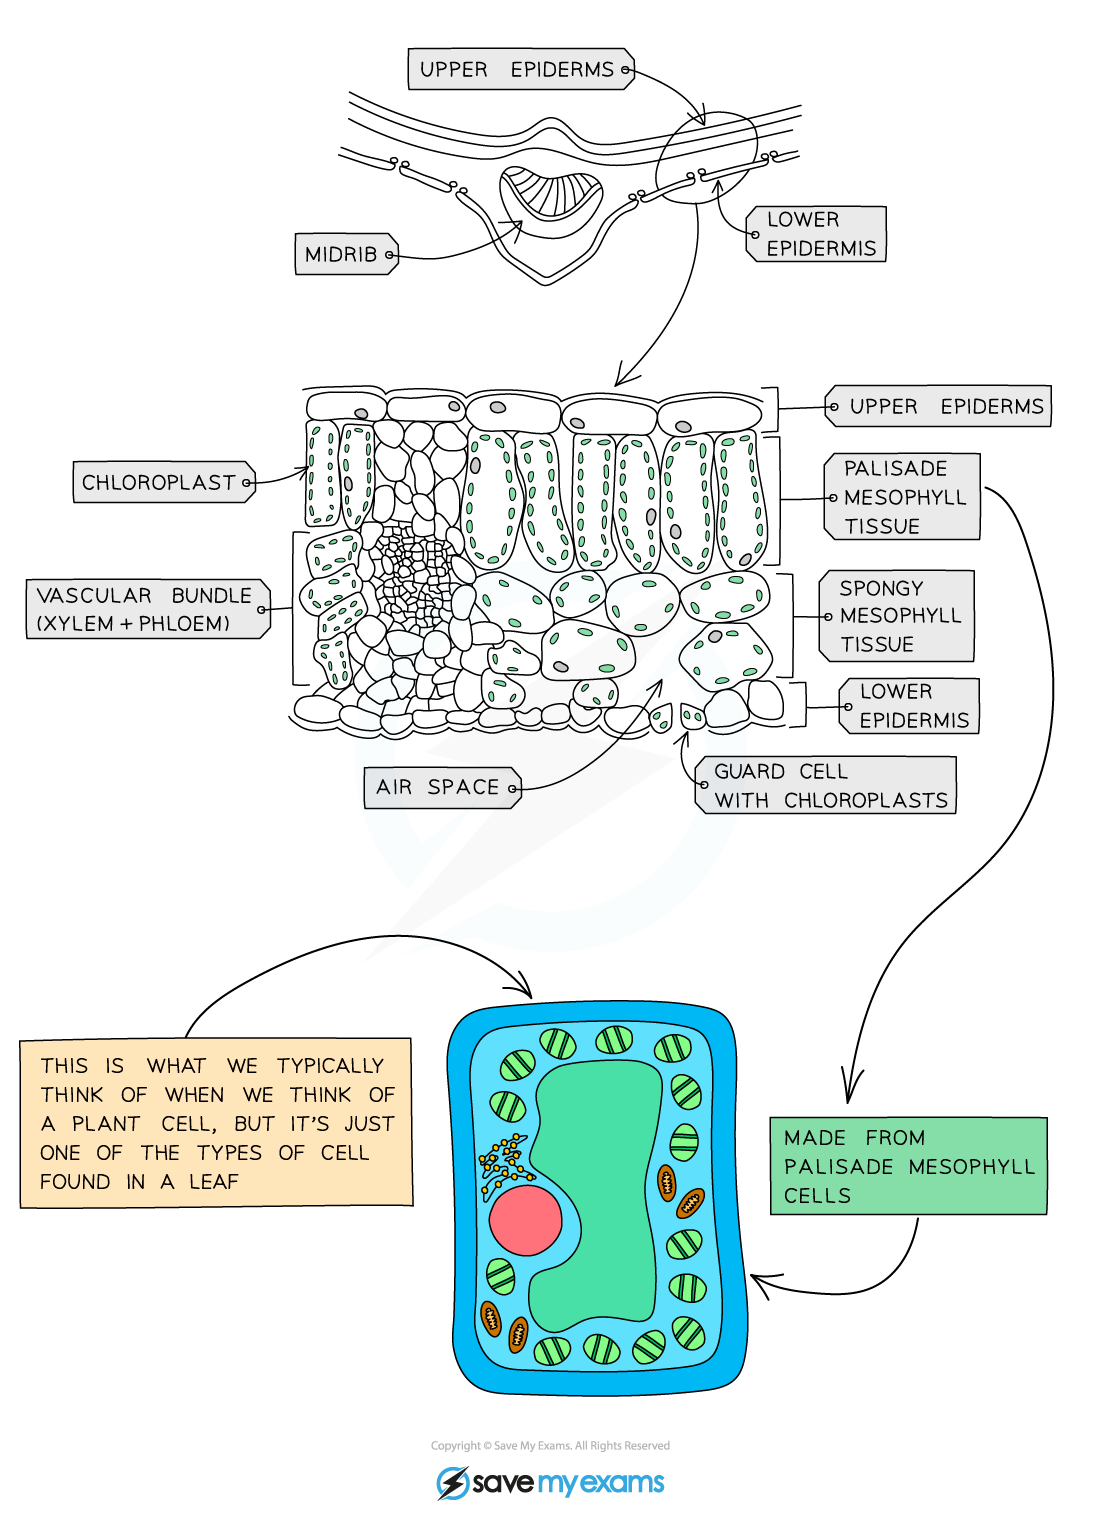
Diagram showing the cross-section of a leaf
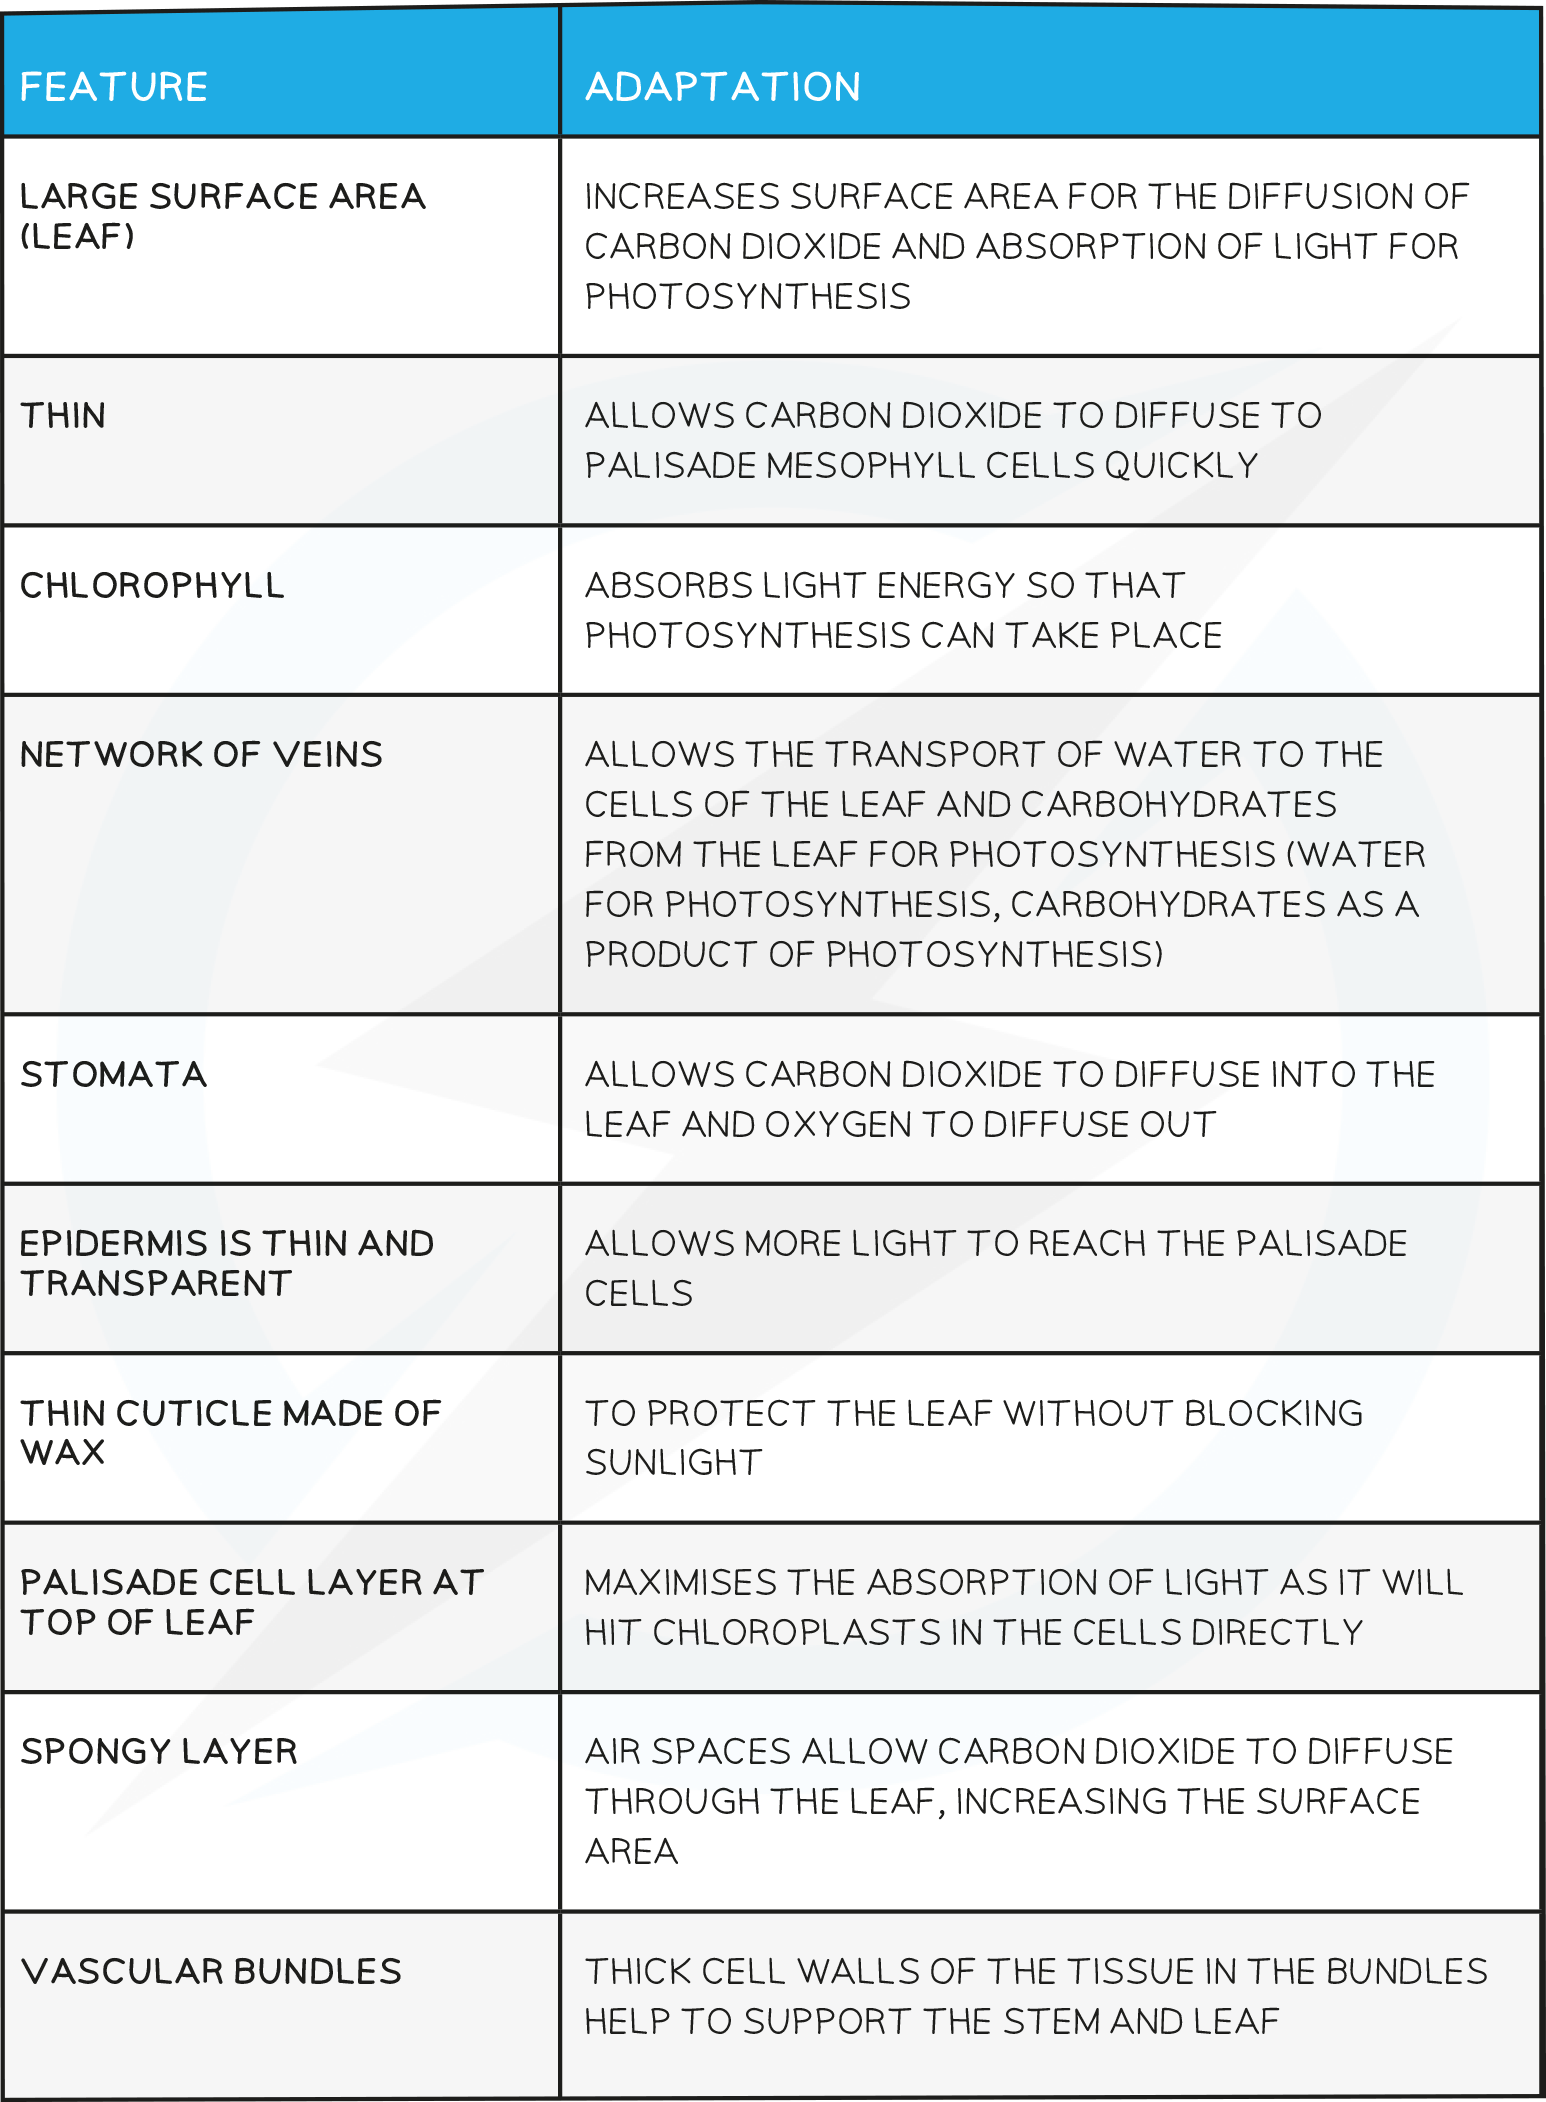
- The specialised cells in leaves have adaptive features which allow them to carry out a particular function in the plant
Adaptations of Plant Leaves for Photosynthesis Table
Mineral Ions
- Photosynthesis provides a source of carbohydrates, but plants contain and require many other types of biological molecule; such as proteins, lipids and nucleic acid (DNA)
- As plants do not eat, they need to make these substances themselves
- Carbohydrates contain the elements carbon, hydrogen and oxygen but proteins, for example, contain nitrogen as well (and certain amino acids contain other elements too)
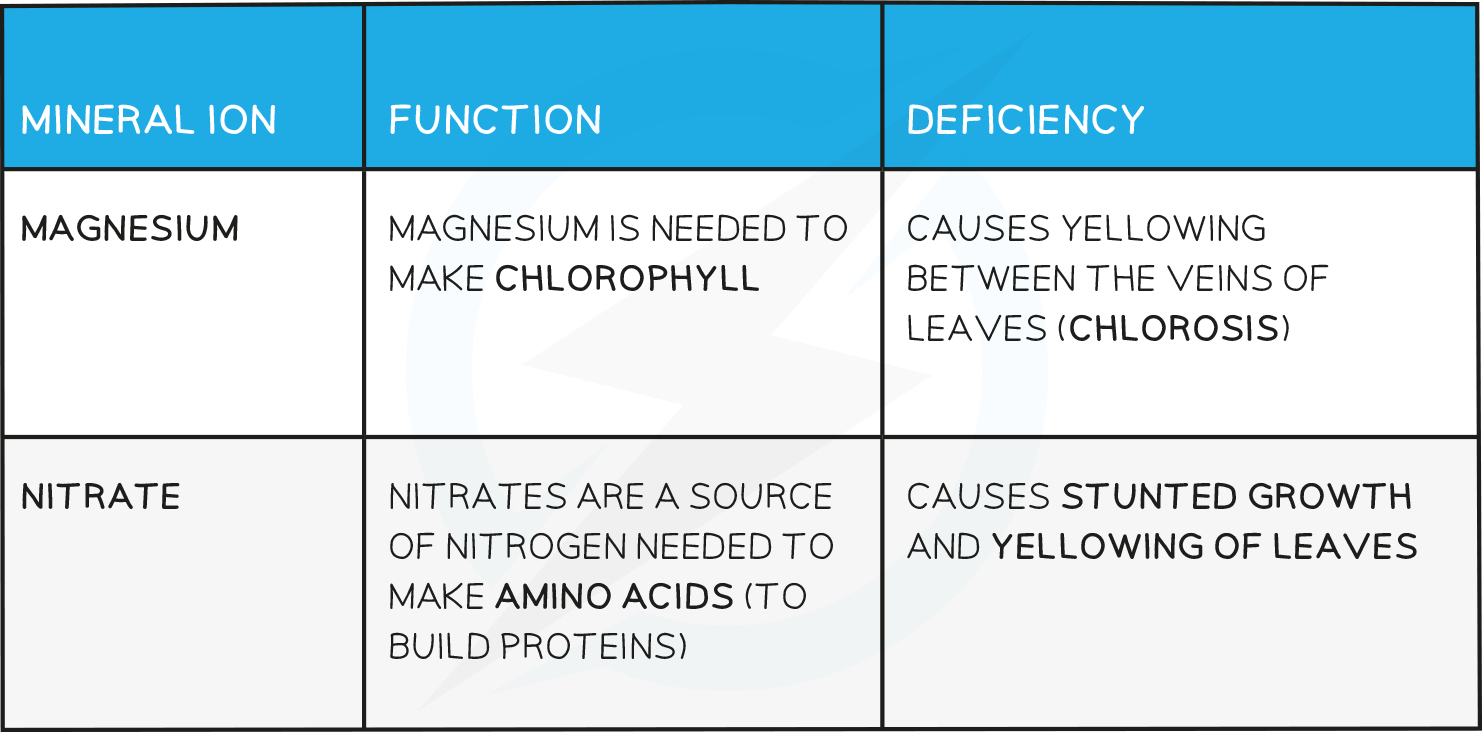
- Two fundamental mineral ions required by plants are nitrogen and magnesium, without a source of these elements, plants cannot photosynthesise or grow properly
- Plants obtain these elements in the form of mineral ions actively absorbed from the soil by root hair cells
- ‘Mineral’ is a term used to describe any naturally occurring inorganic substance
Mineral Ion Function and Deficiencies in Plants Table
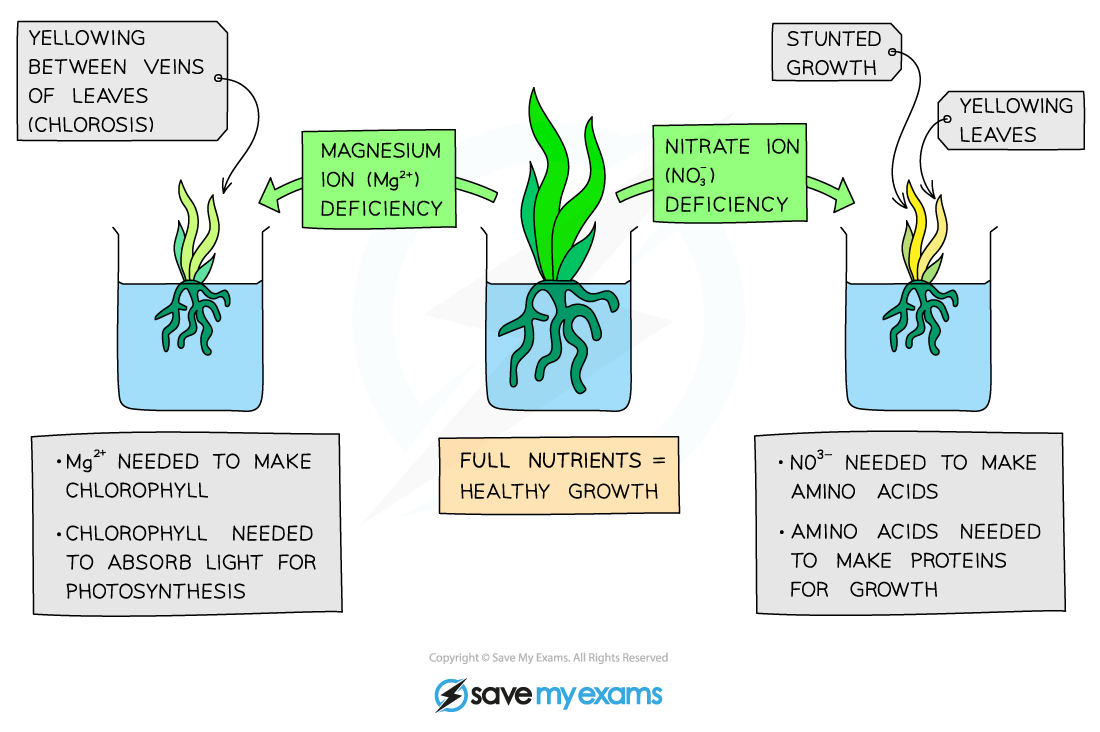
The effect of mineral deficiencies on plants
转载自savemyexams

最新发布
© 2026. All Rights Reserved. 沪ICP备2023009024号-1


