Edexcel A Level Physics:复习笔记4.7 Force-Extension Graphs

Force-Extension Graphs
- The way a material responds to a tensile or compressive force can be shown on a force-extension, or a force-compression graph
- Although compression can be put into equations as a negative value, the graphs have the same shaped curves
- Compression is plotted on the graph as a positive, increasing value
- Every material will have a unique force-extension graph depending on how brittle or ductile it is
- In the same way, materials have unique force-compression graphs, which will not be the same as their force-extension graph
- This is because materials behave differently under tensile and compressive strain
Simple Force-Extension Graphs
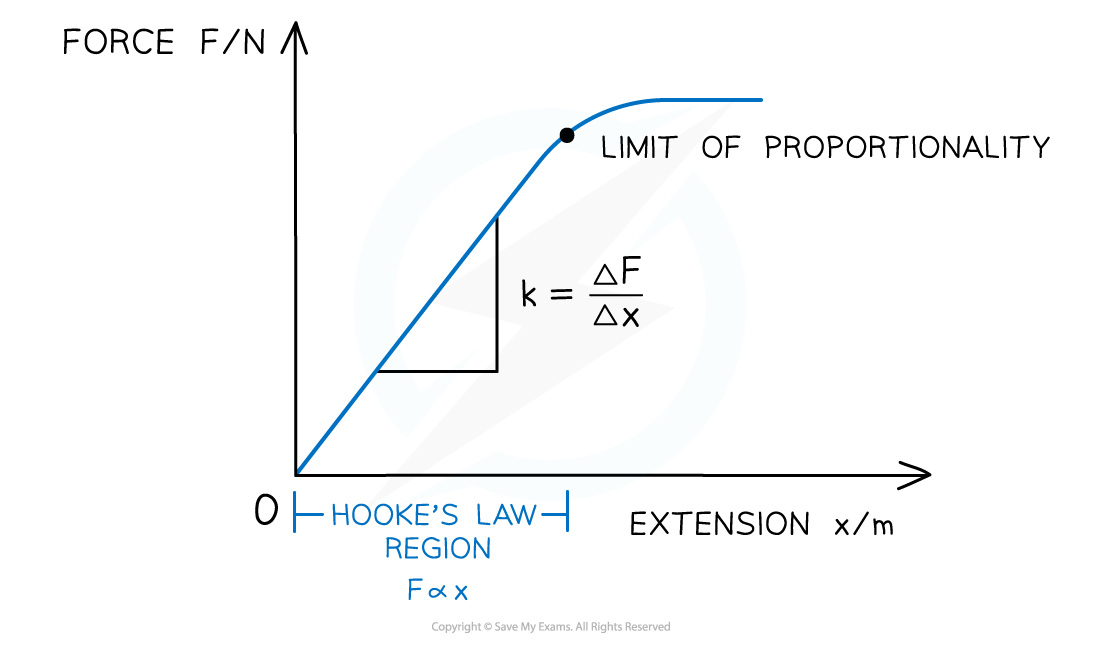
Simple force-extension graph showing the Hooke's Law region, and the calculation to find k, the spring constant
- A material may obey Hooke's Law up to a point
- This is shown on its force-extension graph by a straight line through the origin
- As more force is added, the graph may start to curve slightly
The key features of the graph are:
- The limit of proportionality
- The point beyond which Hooke's law is no longer true when stretching or compressing a material i.e. the extension/ compression is no longer proportional to the applied force
- The point is identified on the graph where the line starts to curve
- The elastic limit
- The point before which a material will return to its original length or shape when the deforming force is removed
- This point is always after the limit of proportionality
- The spring constant k is found from the gradient of the straight part of the graph
More Detailed Force-Extension Graphs
- Graphs of applied load-extension can give more detailed information about materials
- This will apply when loads were continued well past the elastic limit
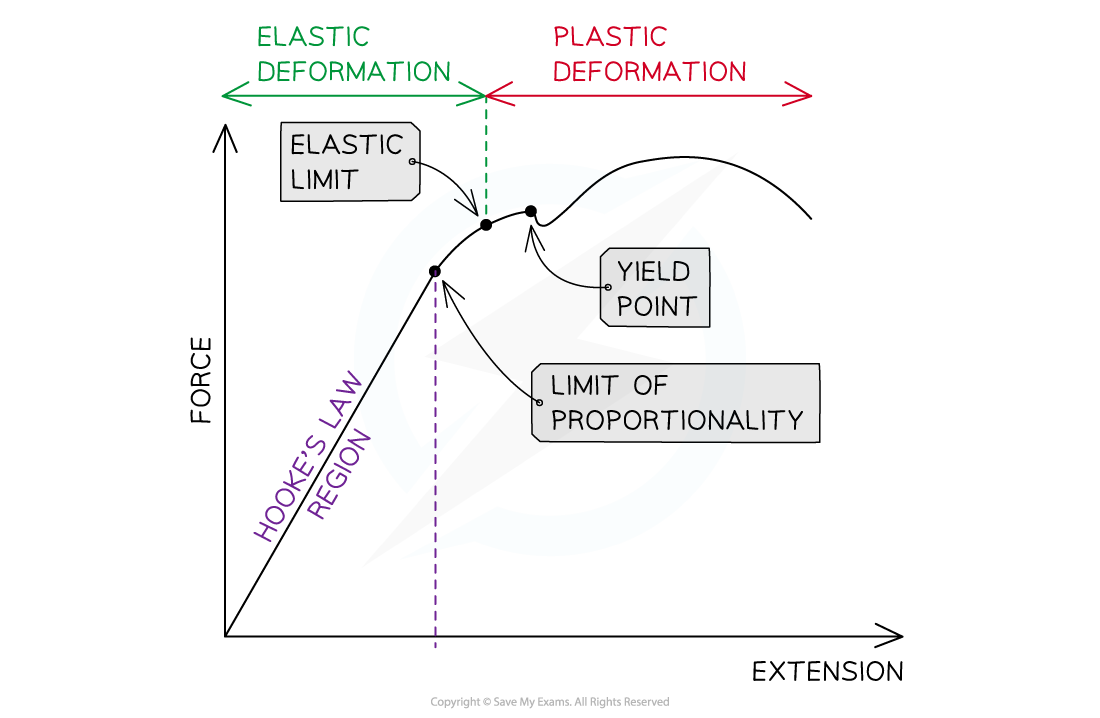
Detailed force-extension graph showing a material under loads which exceed the elastic limit
- The yield point is where the material continues to stretch even though no extra force is being applied to it
- Elastic deformation is a change of shape where the material will return to its original shape when the load is removed
- Plastic deformation occurs after the yield point
- It is a change of shape where the material will not return to its original shape when the load is removed
Worked Example
The graph below shows force plotted against extension for a material under compressive forces.
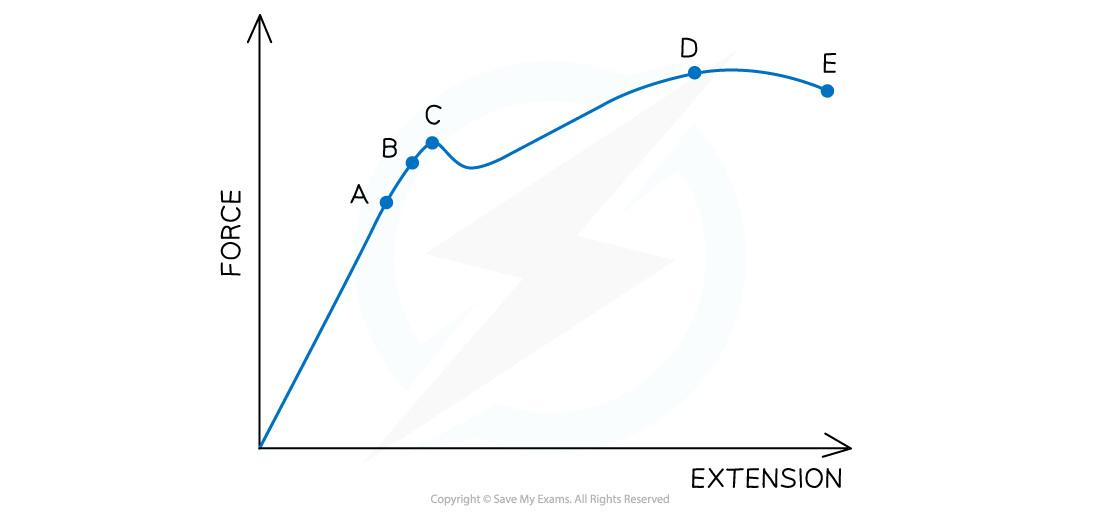
Use the letters marked to identify the elastic limit and yield point, and define both terms.
Step 1: Define both terms
-
- Elastic limit: point before which a material will return to its original length or shape when the deforming force is removed
- Yield point: the point at which the continues to stretch even though no extra force is being applied to it
Step 2: Using your definitions as prompts, select the correct point on the graph
-
- Elastic limit is at B because the line has curved slightly after the Hooke's law region but not started to extend with no extra force
- Yield point is at C because the line increases in the x-direction (extension is increasing) but not in the y-direction (no extra force is being added)
Exam Tip
The detailed graph looks confusing at first because it is such an unusual shape. Try tracing out the line with your finger to see how force and extension are related at each point on the graph.
When defining the terms, be very careful to state whether the material behaves in certain ways either before or after reaching that point.
For example, the limit of proportionality is the point 'beyond which' Hooke's Law no longer applies, not 'at which'.
转载自savemyexams
以上就是关于【Edexcel A Level Physics:复习笔记4.7 Force-Extension Graphs】的解答,如需了解学校/赛事/课程动态,可至翰林教育官网获取更多信息。
往期文章阅读推荐:
翰林独家 | 经济学竞赛核心精讲,一册打通NEC/IEO/USAEBO!
2026 ALEVEL 夏考A率出炉!爱德思vs牛津AQA,哪些科目真的“好出分”?


翰林AMC8视频课重磅上线!

国际竞赛真题资源免费领取






