Edexcel A Level Physics:复习笔记1.4 Limitations of Measurements

Limitations of Measurement
Types of Error
- Measurements of quantities are made with the aim of finding the true value of that quantity
- In reality, it is impossible to obtain the true value of any quantity as there will always be a degree of uncertainty
- This can be seen when you repeat a measurement and you get different results
- An error is the difference between the measurement result and the true value if a true value is thought to exist
- This is not a mistake in the measurement
- The error can be due to both systematic and random effects and an error of unknown size is a source of uncertainty.
- Random and systematic errors are two types of measurement errors that lead to uncertainty
Random error
- Random errors cause unpredictable fluctuations in an instrument’s readings as a result of uncontrollable factors, such as environmental conditions
- This affects the precision of the measurements taken, causing a wider spread of results about the mean value
- To reduce random error:
- Repeat measurements several times and calculate an average from them
Systematic error
- Systematic errors arise from the use of faulty instruments or from flaws in the experimental method
- This type of error is repeated consistently every time the instrument or method are used, which affects the accuracy of all readings obtained
- To reduce systematic errors:
- Instruments should be recalibrated, or different instruments should be used
- Corrections or adjustments should be made to the technique
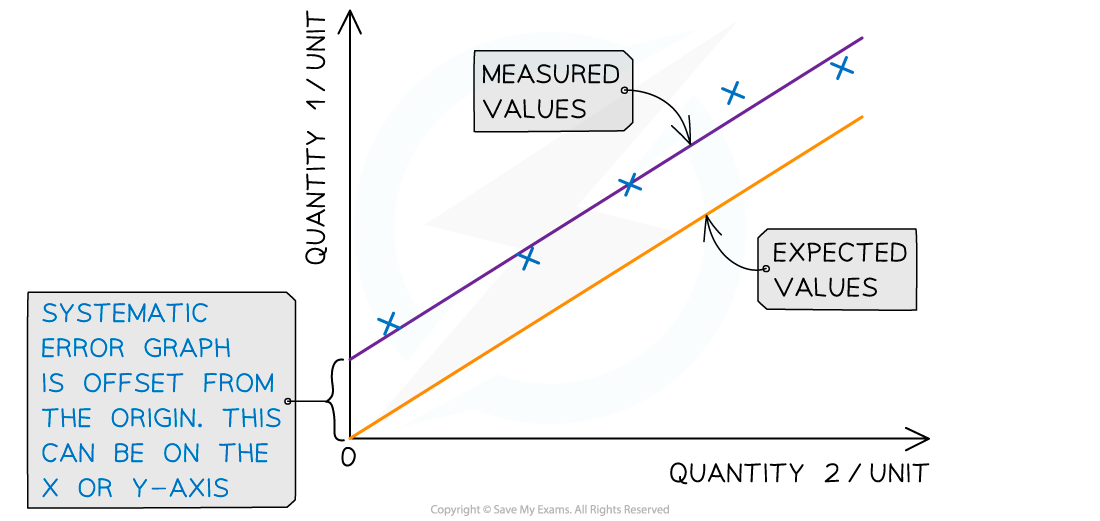
Systematic errors on graphs are shown by the offset of the line from the origin
Representing precision and accuracy on a graph
Zero error
- This is a type of systematic error that occurs when an instrument gives a reading when infact the true reading is zero
- This introduces a fixed error into the readings which must be accounted for when the results are recorded
- Zero error is a type of systematic error since all the values will be displaced by the same amount
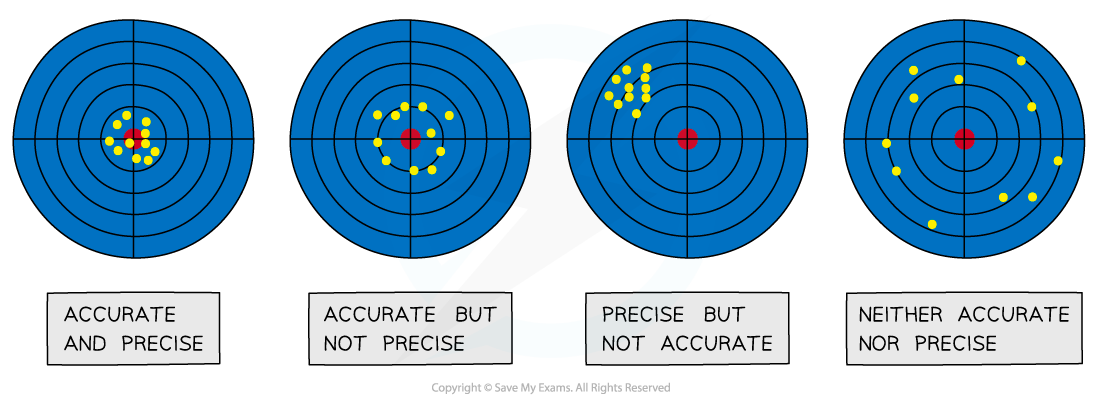
Precision vs Accuracy
Precision
- Precise measurements denote the closeness of agreement (consistency) between values obtained by repeated measurement
- This is influenced only by random effects and can be expressed numerically by measures such as standard deviation.
- A measurement is precise if the values ‘cluster’ closely together.
- Precise measurements have very little spread about the mean value, in other words, how close the measured values are to each other
- If a measurement is repeated several times, it can be described as precise when the values are very similar to, or the same as, each other
- The precision of a measurement is reflected in the values recorded - measurements to a greater number of decimal places are said to be more precise than those to a whole number
Accuracy
- A measurement is considered accurate if it is close to the true value
- It is a quality denoting the closeness of agreement between measurement and true value
- It cannot be quantified and is influenced by random and systematic errors
- The accuracy can be increased by repeating measurements and finding a mean of the results
- Repeating measurements also helps to identify anomalies that can be omitted from the final results
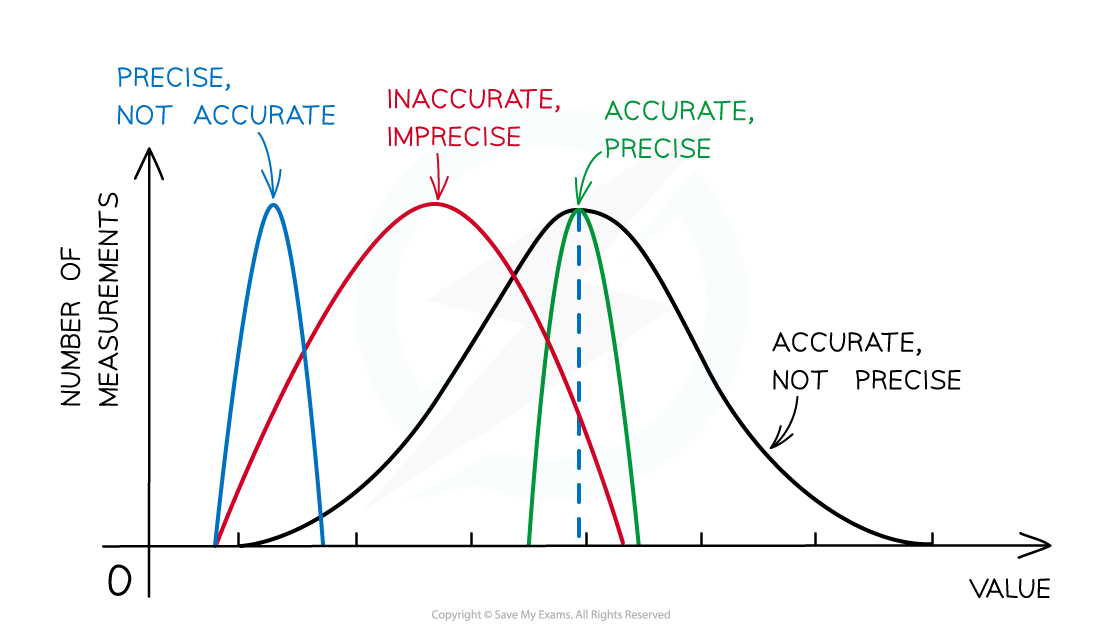
The difference between precise and accurate results
Resolution
- Resolution is the smallest change in the quantity being measured
- It gives a perceptible change in the reading
- It is also the source of uncertainty in a single reading
- For example, the resolution of a wristwatch is 1 s, whereas the resolution of a digital stop-clock is typically 10 ms (0.01 s)
- In imaging, resolution can also be described as the ability to see two structures as two separate structures rather than as one fuzzy entity
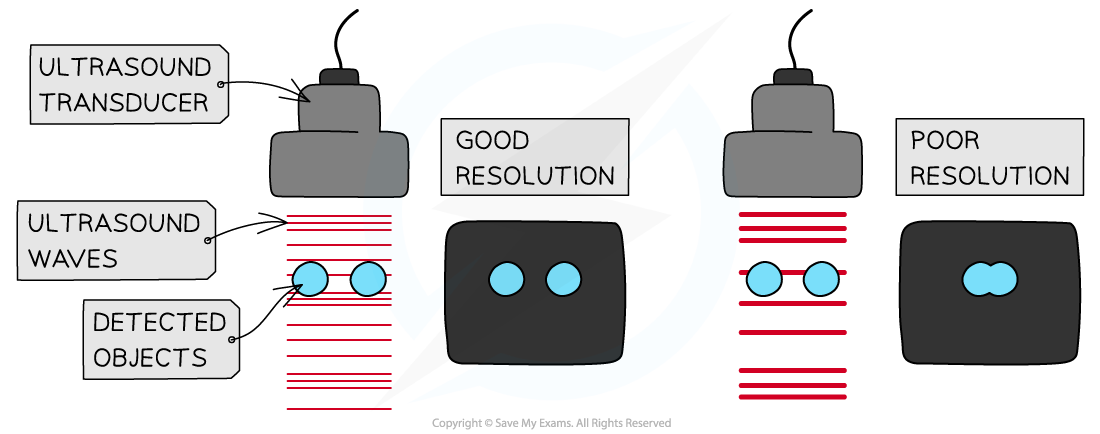
Good resolution and poor resolution in an ultrasound scanner. The good image manages to resolve the two objects into two distinct structures, whereas the poor image shows one fuzzy entity.
Uncertainties
- Uncertainty is an estimate of the difference between a measurement reading and the true value
- In other words, it is the interval within which the true value can be considered to lie with a given level of confidence or probability
- Any measurement will have some uncertainty about the result, this will come from variation in the data obtained and be subject to systematic or random effects
- Uncertainties are not the same as errors
- Errors can be thought of as issues with equipment or methodology that cause a reading to be different from the true value
- The uncertainty is a range of values around a measurement within which the true value is expected to lie, and is an estimate
- For example, if the true value of the mass of a box is 950 g, but a systematic error with a balance gives an actual reading of 952 g, the uncertainty is ±2 g
- These uncertainties can be represented in a number of ways:
- Absolute Uncertainty: where uncertainty is given as a fixed quantity
- Fractional Uncertainty: where uncertainty is given as a fraction of the measurement
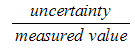
- Percentage Uncertainty: where uncertainty is given as a percentage of the measurement
- Percentage uncertainty is defined by the equation:

- To find uncertainties in different situations:
- The uncertainty in a reading: ± half the smallest division
- The uncertainty in a measurement: at least ±1 smallest division
- The uncertainty in repeated data: half the range i.e. ± ½ (largest - smallest value)
- The uncertainty in digital readings: ± the last significant digit unless otherwise quoted
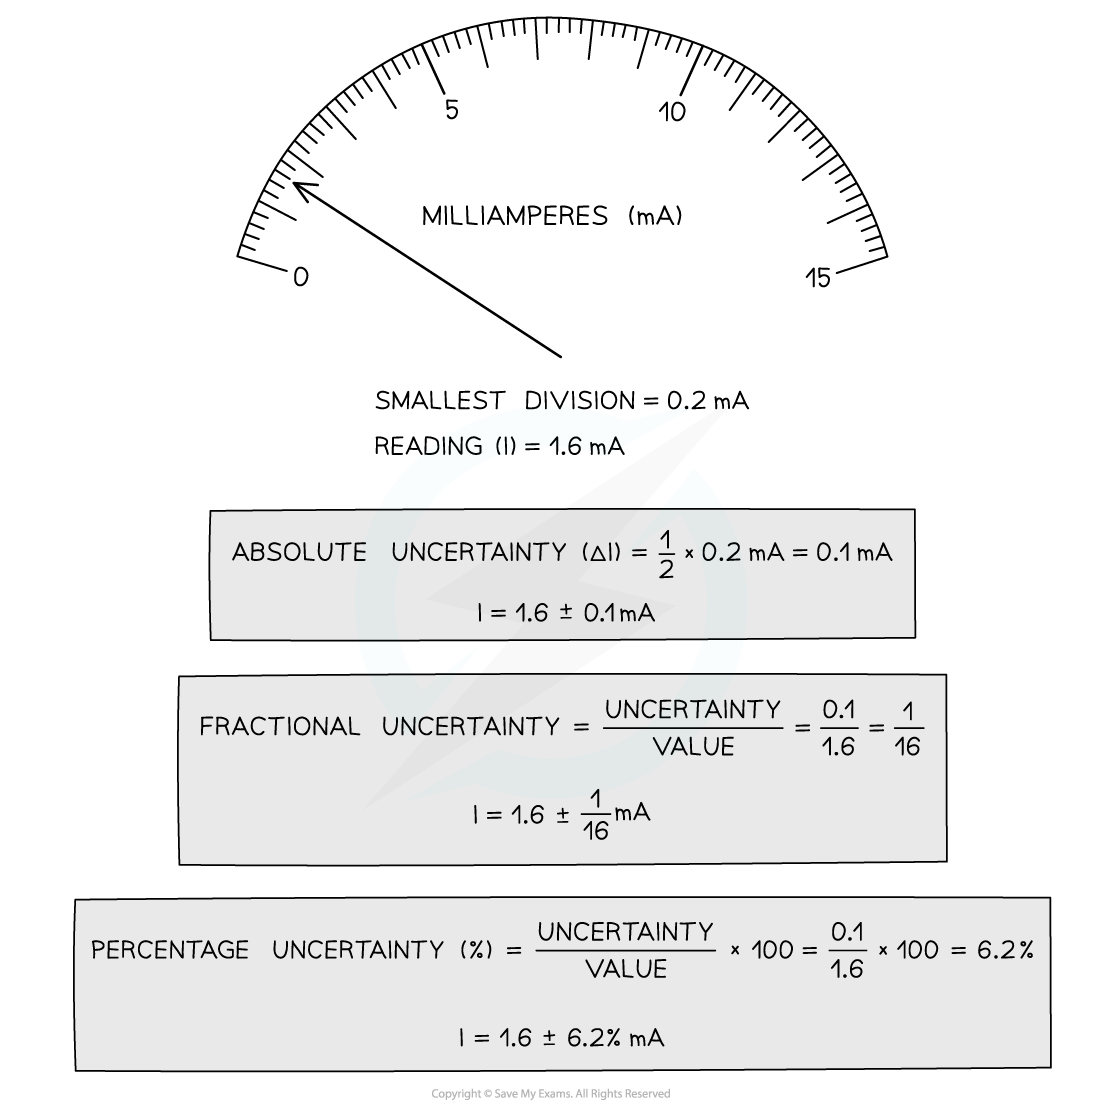
How to calculate absolute, fractional and percentage uncertainty
- Always make sure your absolute or percentage uncertainty is to the same number of significant figures as the reading
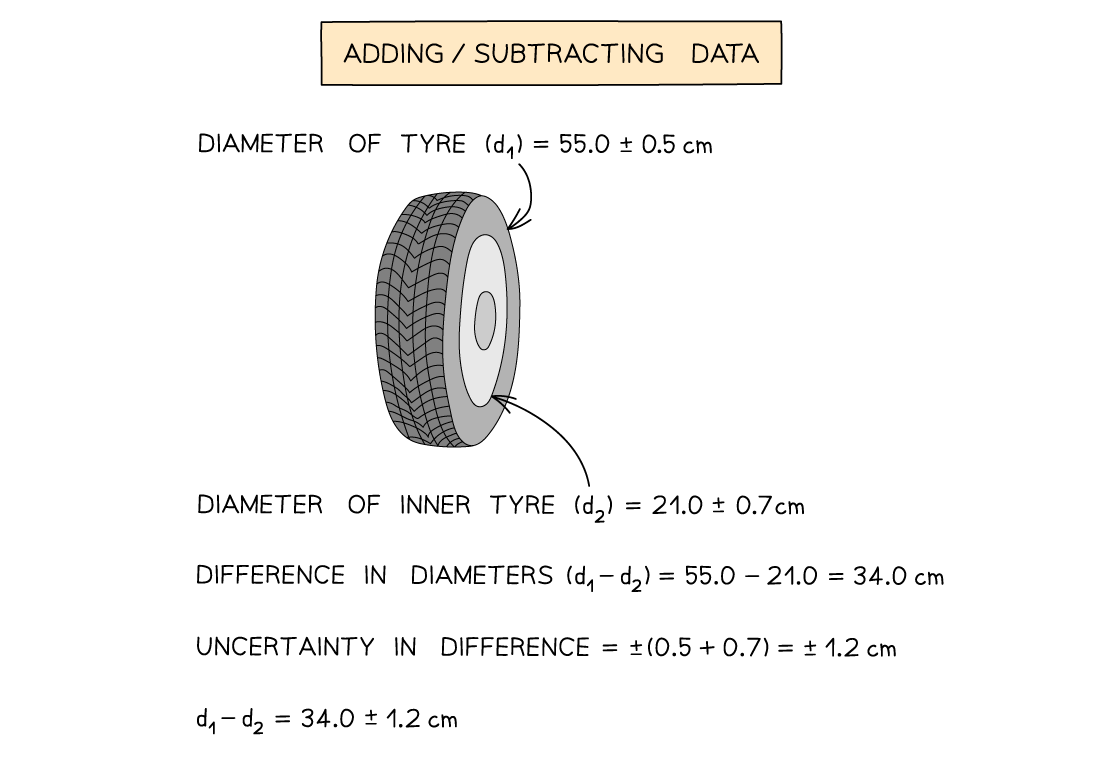
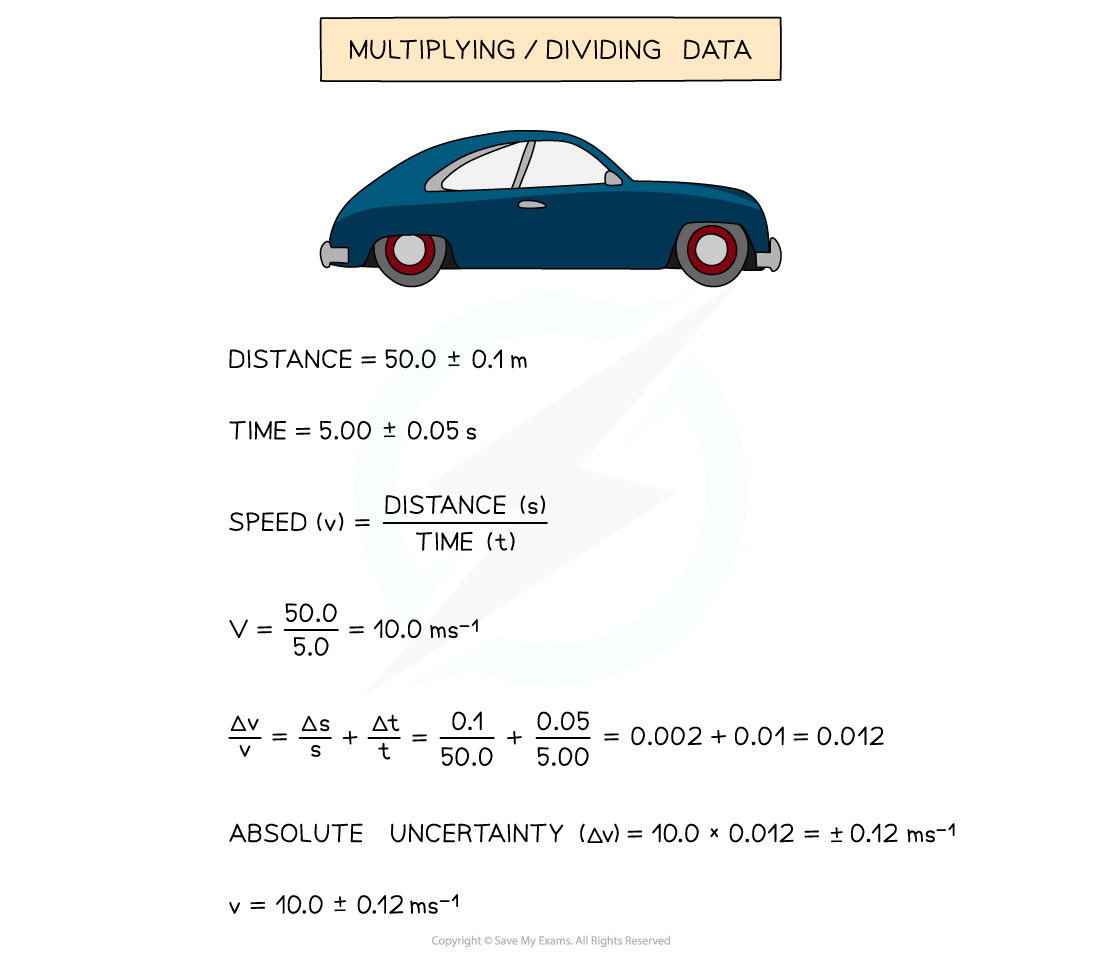
Combining Uncertainties
- When combining uncertainties, the rules are as follows:
Adding / Subtracting Data
- Add together the absolute uncertainties
Multiplying / Dividing Data
- Add the percentage or fractional uncertainties
Raising to a Power
- Multiply the percentage uncertainty by the power

Worked Example
A student achieves the following results in their experiment for the angular frequency, ω of a rotating ball bearing.
0.154, 0.153, 0.159, 0.147, 0.152
Calculate the percentage uncertainty in the mean value of ω.
Step 1: Calculate the mean value
mean ω = ![]() = 0.153 rad s–1
= 0.153 rad s–1
Step 2: Calculate half the range (this is the uncertainty for multiple readings)
![]() × (0.159 – 0.147) = 0.006 rad s–1
× (0.159 – 0.147) = 0.006 rad s–1
Step 3: Calculate percentage uncertainty
 × 100 % =
 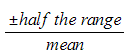 × 100 %
![]() × 100 % = 3.92 %
× 100 % = 3.92 %
Exam Tip
It is a very common mistake to confuse precision with accuracy - measurements can be precise but not accurate if each measurement reading has the same error. Make sure you learn that precision refers to the ability to take multiple readings with an instrument that are close to each other, whereas accuracy is the closeness of those measurements to the true value.
Remember:
- Absolute uncertainties have the same units as the quantity
- Percentage uncertainties have no units
- The uncertainty in numbers and constants, such as π, is taken to be zero
转载自savemyexams
以上就是关于【Edexcel A Level Physics:复习笔记1.4 Limitations of Measurements】的解答,如需了解学校/赛事/课程动态,可至翰林教育官网获取更多信息。
往期文章阅读推荐:
全网破防!ALevel CIE数学M1疑似错题?经济P2难度飙升?5月6日大考考情分析必看!
A-Level CIE就大规模泄题发布最严处罚!哪些考生必须重考?你的成绩怎么办?

翰林AMC8视频课重磅上线!

国际竞赛真题资源免费领取


