- 翰林提供学术活动、国际课程、科研项目一站式留学背景提升服务!
- 400 888 0080
Edexcel A Level Economics A:复习笔记1.2.4 Supply
Supply
- Supply is the amount of a good/service that a producer is willing and able to supply at a given price in a given time period
- A supply curve is a graphical representation of the price and quantity supplied by producers
- If data were plotted, it would be an actual curve, however economists simplify curves in their sketches into straight lines so as to make analysis easier
- The supply curve is sloping upward as there is a positive relationship between price and quantity supplied
- Rational profit maximising producers would want to supply more as prices increase in order to maximise their profits

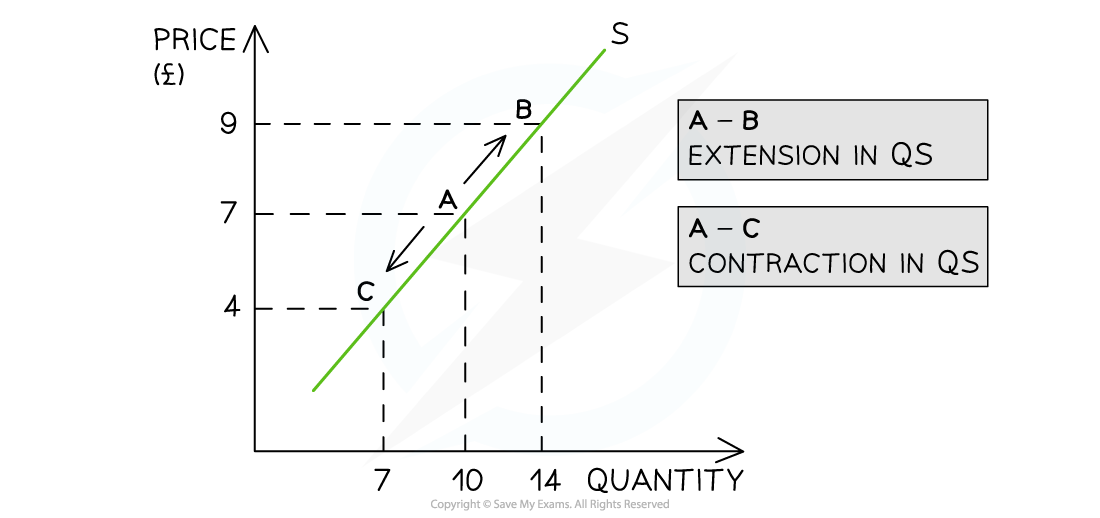
A supply curve showing an extension in quantity supplied (QS) as prices increase and a contraction in quantity supplied (QS) as prices decrease
Diagram Analysis
- If price is the only factor that changes (ceteris paribus), there will be a change in the quantity supplied (QS)
- This change is shown by a movement along the supply curve
- An increase in price from £7 to £9 leads to a movement up the supply curve from point A to B
- Due to the increase in price, the quantity supplied has increased from 10 to 14 units
- This movement is called an extension in QS
- A decrease in price from £7 to £4 leads to a movement down the supply curve from point A to C
- Due to the decrease in price, the quantity supplied has decreased from 10 to 7 units
- This movement is called a contraction in QS
The Conditions of Supply
- There are several factors that will change the supply of a good/service, irrespective of the price level. Collectively these factors are called the conditions of supply
- Changes to any of the conditions of supply shifts the entire supply curve (as opposed to a movement along the supply curve)

A graph that shows how changes to any of the conditions of supply shifts the entire supply curve left or right, irrespective of the price level
- For example, if a firm's cost of production increases due to the increase in price of a key resource, then there will be a decrease in supply as the firm can now only afford to produce fewer products
- This is a shift in supply from S to S1. The price remains unchanged at £7 but the supply has decreased from 10 to 2 units
An Explanation of How Each of the Conditions of Supply Shifts the Entire Supply
Curve at Every Price Level
| Condition | Explanation | Condition | Shift | Condition | Shift |
| Costs of Production (COP) |
If the price of raw materials or other costs of production change, firms respond by changing supply |
COP Increases |
S Shifts Left (S→S1) |
COP Decreases |
S Shifts Right (S→S2) |
| Indirect Taxes | Any changes to specific taxes or ad valorem taxes change the cost of production for a firm and impact supply | Taxes Increase | S Shifts Left (S→S1) |
Taxes Decrease | S Shifts Right (S→S2) |
| Subsidies | Changes to producer subsidies directly impact the cost of production for the firm | Subsidy Increases | S Shifts Right (S→S2) |
Subsidy Decreases | S Shifts Left (S→S1) |
| New Technology | New technology increases productivity and lowers costs of production. Ageing technology can have the opposite effect | Technology Increases | S Shifts Right (S→S2) |
Technology Decreases | S Shifts Left (S→S1) |
| Change in the number of firms in the industry | The entry and exit of firms into the market has a direct impact on the supply. If ten new firms start selling building materials in Nuneaton, the supply of building material will increase | No. of Firms Increases | S Shifts Right (S→S2) |
No. of Firms Decreases | S Shifts Left (S→S1) |
Exam Tip
Several of the conditions of supply change the costs of production. However, be sure to explain each condition as its own point before linking it to the cost of production (for example, a change in indirect taxation).
A common error by students is to explain that a subsidy (for example, £3,000 subsidy for each electric vehicle produced) shifts the demand curve for electric vehicles to the right. This is incorrect. The subsidy will shift the supply curve to the right. Then due to the lower price, there will be a movement along the demand curve (extension of quantity demanded) to create a new market equilibrium.
转载自savemyexams

早鸟钜惠!翰林2025暑期班课上线

最新发布
© 2025. All Rights Reserved. 沪ICP备2023009024号-1


