- 翰林提供学术活动、国际课程、科研项目一站式留学背景提升服务!
- 400 888 0080
Edexcel A Level Economics A:复习笔记1.2.2 Demand
Demand
- Demand is the amount of a good/service that a consumer is willing and able to purchase at a given price in a given time period
- If a consumer is willing to purchase a good, but cannot afford to, it is not effective demand
- A demand curve is a graphical representation of the price and quantity demanded (QD) by consumers
- If data were plotted, it would be an actual curve, however economists simplify curves in their sketches into straight lines so as to make analysis easier
Movements Along A Demand Curve
- If price is the only factor that changes (ceteris paribus), there will be a change in the QD
- This change is shown by a movement along the demand curve

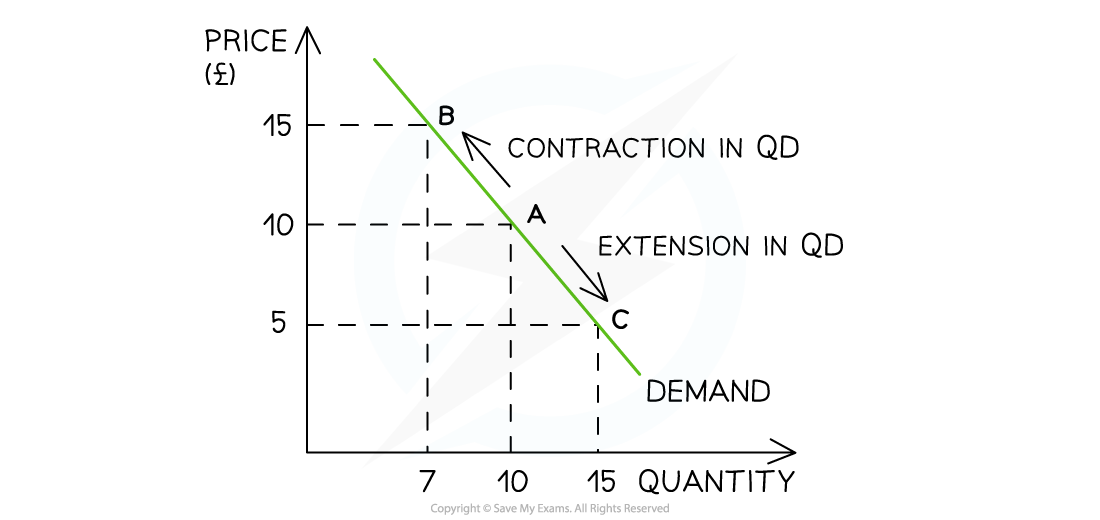
A demand curve showing a contraction in quantity demanded (QD) as prices increase and an extension in quantity demanded (QD) as prices decrease
Diagram Analysis
- An increase in price from £10 to £15 leads to a movement up the demand curve from point A to B
- Due to the increase in price, the QD has fallen from 10 to 7 units
- This movement is called a contraction in QD
- A decrease in price from £10 to £5 leads to a movement down the demand curve from point A to point C
- Due to the decrease in price, the QD has increased from 10 to 15 units
- This movement is called an extension in QD
- The law of demand captures this fundamental relationship between price and QD
- It states that there is an inverse relationship between price and QD
- When price rises the QD falls
- When prices fall the QD rises
- It states that there is an inverse relationship between price and QD
- This relationship partly explains why the demand curve is downward sloping
Conditions of Demand
Shifts Of The Entire Demand Curve
- There are numerous factors that will change the demand for a good/service, irrespective of the price level. Collectively these factors are called the conditions of demand
- Changes to each of the conditions of demand, shifts the entire demand curve (as opposed to a movement along the demand curve)

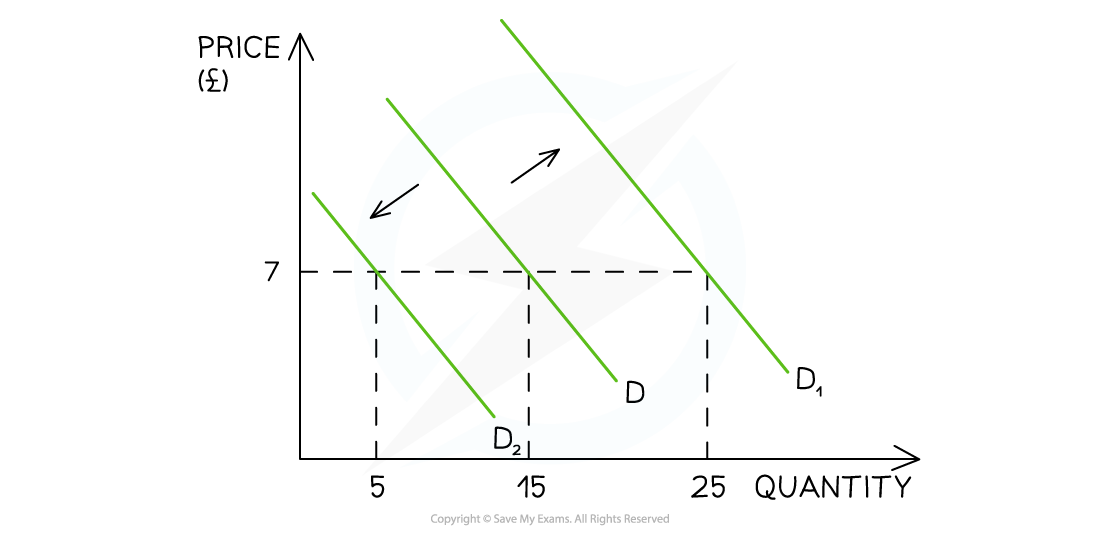
A graph that shows how changes to any of the conditions of demand shifts the entire demand curve left or right, irrespective of the price level
- For example, if a firm increases their Instagram advertising, there will be an increase in demand as more consumers become aware of the product
- This is a shift in demand from D to D1. The price remains unchanged at £7 but the demand has increased from 15 to 25 units
An Explanation of How Each of the Conditions of Demand Shifts the Entire Demand
Curve at Every Price Level
| Condition | Explanation | Condition | Shift | Condition | Shift |
| Changes in Real Income |
|
Income Increases |
D Shifts Right (D→D1) |
Income Decreases |
D Shifts Left (D→D2) |
| Changes in taste/fashion |
|
Good becomes more fashionable | D Shifts Right (D→D1) |
Good becomes less fashionable | D Shifts Left (D→D2) |
|
Advertising/ |
|
Advertising Increases | D Shifts Right (D→D1) |
Advertising Decreases | D Shifts Left (D→D2) |
|
Changes in the prices of substitute goods |
|
Price of Good A Increases | D for Good B Shifts Right (D→D1) |
Price of Good A Decreases | D for Good B Shifts Left (D→D2) |
|
Changes in the prices of complementary goods |
|
Price of Good A Increases | D for Good B Shifts Left (D→D2) |
Price of Good A Decreases | D for Good B Shifts Right (D→D1) |
|
Changes in population size/distribution
|
|
Population Increases | D Shifts Right (D→D1) |
Population Decreases | D Shifts Left (D→D2) |
Exam Tip
The difference between a movement along the demand curve and a shift in demand is essential to understand. You will be repeatedly examined on this and it is important that you use the correct language to show that you understand the difference between a change in quantity demanded and a change in demand.
When price changes (ceteris paribus), there is a movement along the demand curve resulting in a change to quantity demanded. When a condition of demand changes, there is a shift of the entire demand curve resulting in a change to demand.
Diminishing Marginal Utility
- Marginal utility is the additional utility (satisfaction) gained from the consumption of an additional product
- The utility gained from consuming the first unit is usually higher than the utility gained from consuming the next unit
- For example, a hungry consumer gains high utility from eating their first hamburger. They are still hungry and purchase a second hamburger but gain less satisfaction from eating it than they did from the first hamburger
- To calculate total utility, the marginal utility of each unit consumed is added together
- This means that total utility keeps increasing even while marginal utility is decreasing
- The Law of Diminishing Marginal Utility states that as additional products are consumed, the utility gained from the next unit is lower than the utility gained from the previous unit
- The Law of Diminishing Marginal Utility helps to explain the reason why the demand curve is downward sloping
- When the first unit is purchased, the utility is high and consumers are willing to pay a high price
- When subsequent units are purchased, each one offers less utility and the willingness of the consumer to pay the initial price decreases
- Lowering the price makes it a more attractive proposition for the consumer to keep consuming additional units
- This is one reason why firms offer discounts such as '50% off the second item'
转载自savemyexams

早鸟钜惠!翰林2025暑期班课上线

最新发布
© 2025. All Rights Reserved. 沪ICP备2023009024号-1


