Edexcel A Level Chemistry:复习笔记5.5.5 Continuous Monitoring Method
Continuous Monitoring Method
- Continuous monitoring involves collecting experimental data throughout the course of a reaction to plot a concentration-time graph
- Two of the most common ways to collect this data are by:
- Measuring the volume / amount of gas evolved over time
- Measuring the mass of reactants lost over time
- Another alternative method involves the use of colorimetry:
The iodination of propanone
- The iodination of propanone provides a suitable experiment in which the rate of reaction can be measured throughout the reaction by using a colorimeter
- The reaction is carried out using a catalyst of dilute sulfuric acid
- The iodine decolourises during the reaction as it turns into iodopropanone and hydrogen iodide:
CH3COCH3 + I2 → CH3COCH2I + HI
- The colorimeter measures colour absorbance which is proportional to the concentration of the coloured species
- Before the investigation begins it is necessary to measure the absorbance of a set of standard solutions of iodine and obtain a calibration curve
- For example, here is a calibration curve for a transition metal ion that allows you to convert colorimeter readings into concentrations:
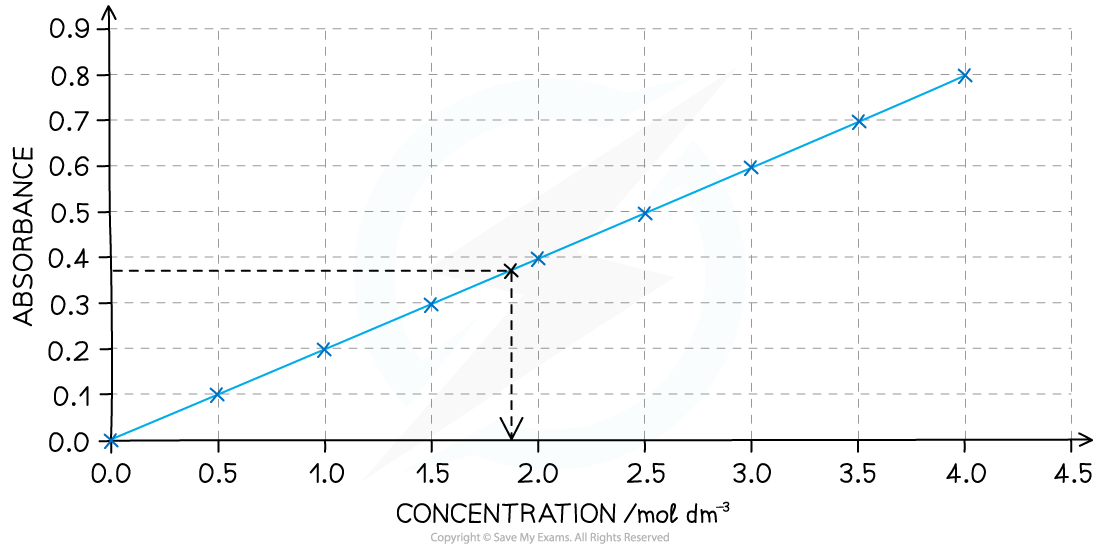
A calibration curve showing the relationship between colour absorbance and concentration
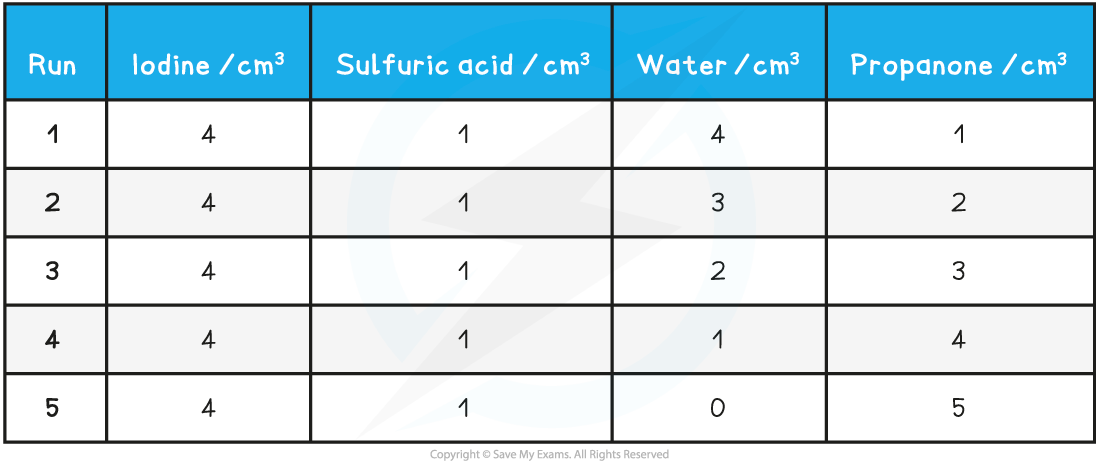
- The colorimeter uses very small volumes of solutions, so four burettes can be filled with solutions of 0.02 mol dm-3 iodine, 1.0 mol dm-3 propanone and 1.0 mol dm-3 sulfuric acid and distilled water
- By varying the volumes of solutions while maintaining a constant total volume with the use of distilled water, you can obtain a number of different concentrations
- The solutions are measured into a small beaker, leaving the iodine in a separate beaker - this starts the reaction, so it can be added when you start a timer or stop watch
- The iodine is added to the other liquids, the contents mixed and then quickly transferred into the cuvette (small receptacle) and the colorimeter / data logger started
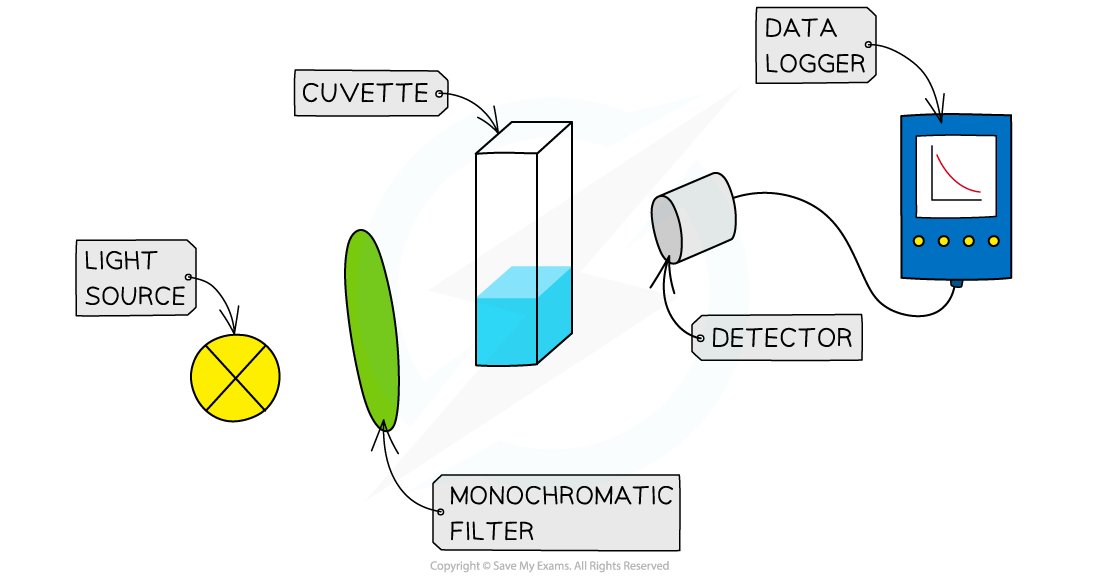
The set up for using a colorimeter and data logger to continuously measure the rate of reaction
- A typical set of volume compositions could be as follows:
Volume Compositions Table
 Practical tip
- Choose a filter that gives the strongest absorbance for the solution you are using - this will be the complementary colour to the colour of the solution under investigation
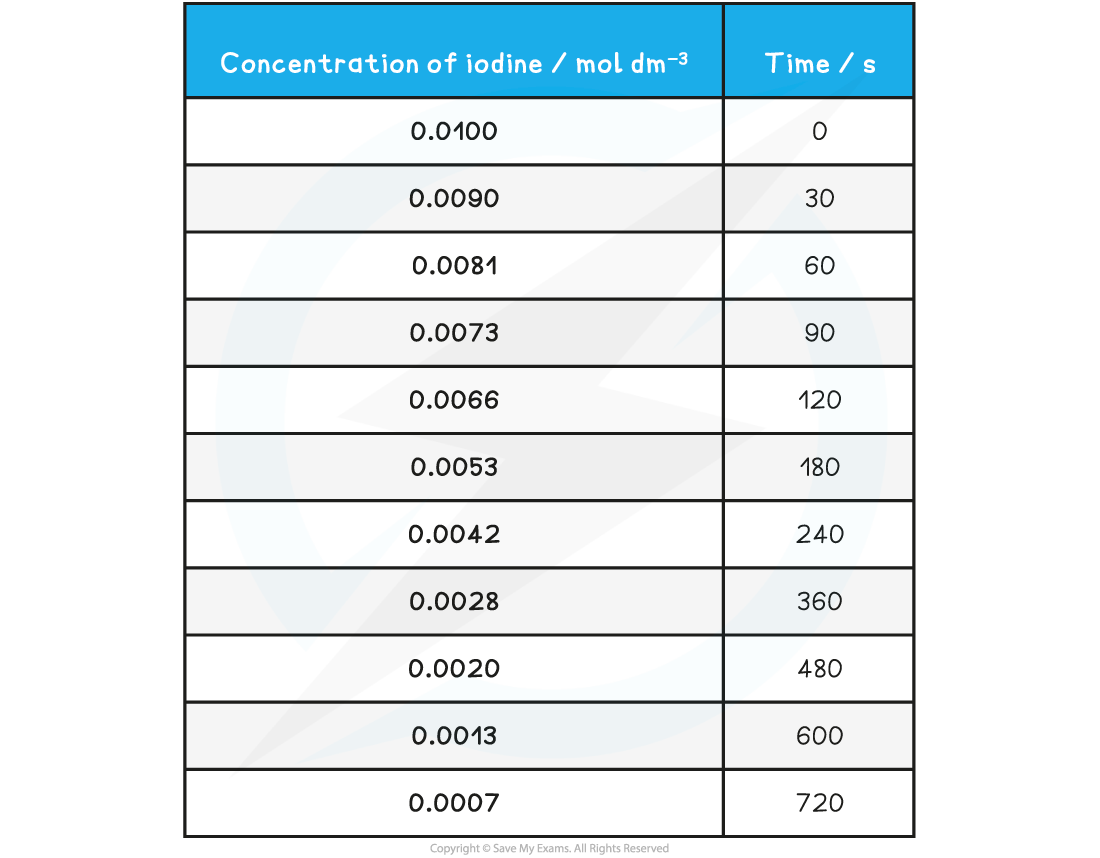
Specimen results table for the iodination of propanone
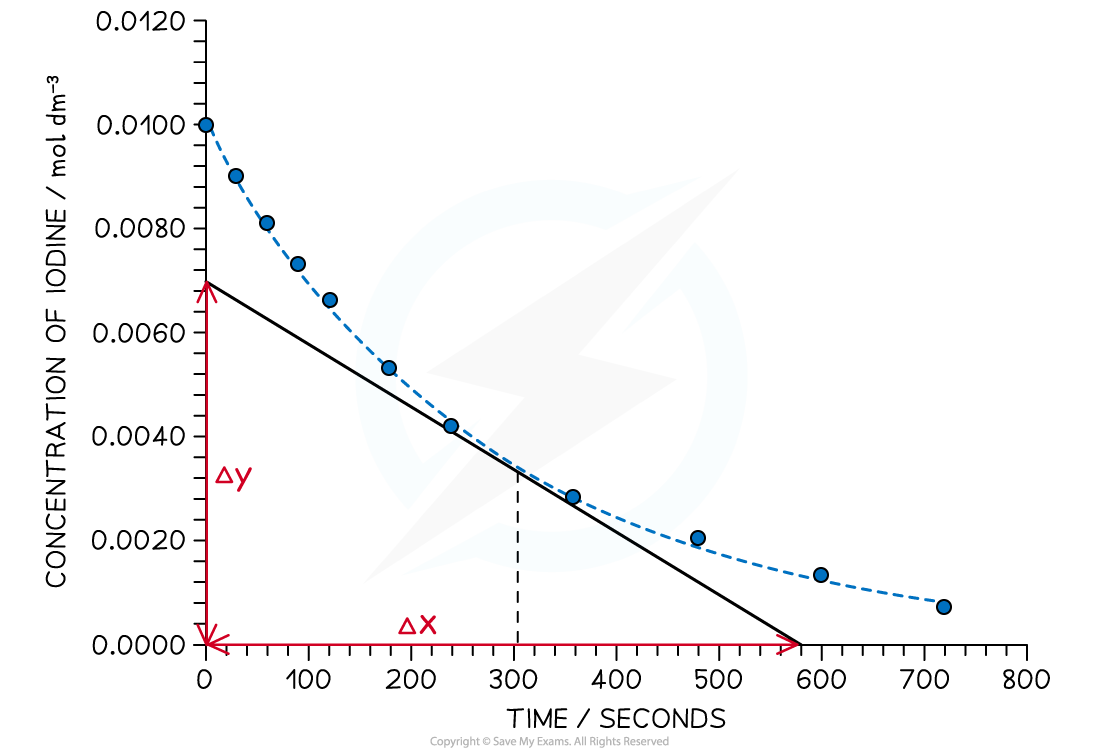
Graph showing the change in concentration of iodine during the course of the reaction
Measuring rate
- To find the rate of reaction at any point, a tangent is drawn and the gradient is determined
- The gradient gives the rate of reaction
- For example, in the graph above, the rate of reaction at 300 seconds can be found
- A vertical line is drawn from the 300 s mark until it meets the curve, then a tangent is drawn
- Gradient
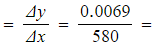 1.19 x 10⁻⁵ mol dm-3 s-1
-
- The gradient is the rate of reaction at that point
Exam Tip
Whichever rates experiments you carry out, make sure you can
- describe the steps in the procedure
- name all the apparatus used
- draw data tables which include headings and units
- draw graphs showing labels, units and best fit lines
- determine an initial gradient or at any point in the curve
转载自savemyexams

国际竞赛真题资料-点击免费领取!

早鸟钜惠!翰林2025暑期班课上线

美高学分项目重磅来袭!立即了解