- 翰林提供学术活动、国际课程、科研项目一站式留学背景提升服务!
- 400 888 0080
CIE A Level Maths: Pure 3复习笔记8.2.1 Argand Diagrams - Basics
Argand Diagrams - Basics
What is an Argand diagram?
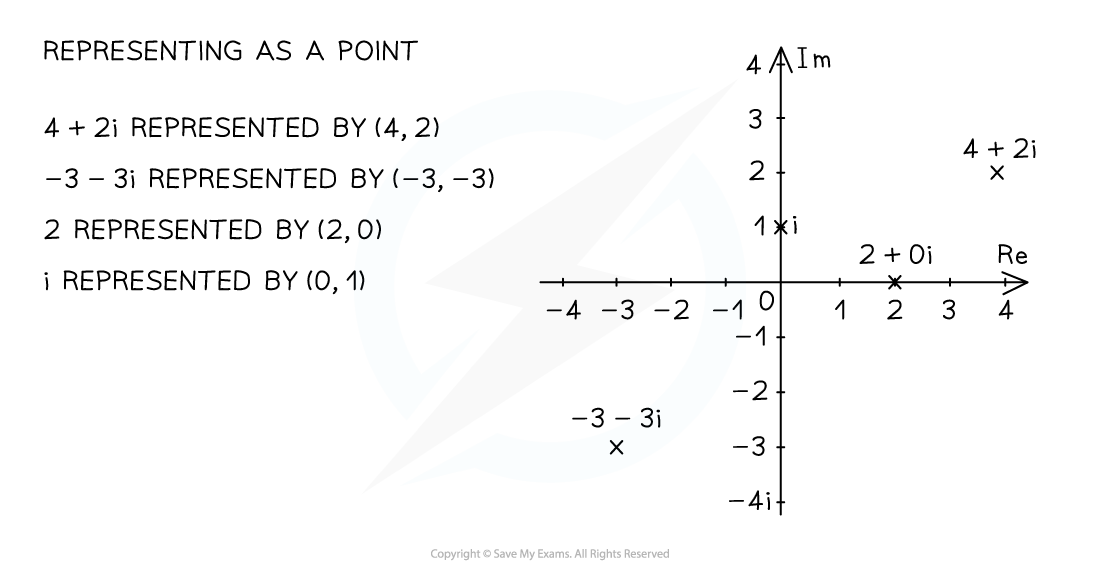
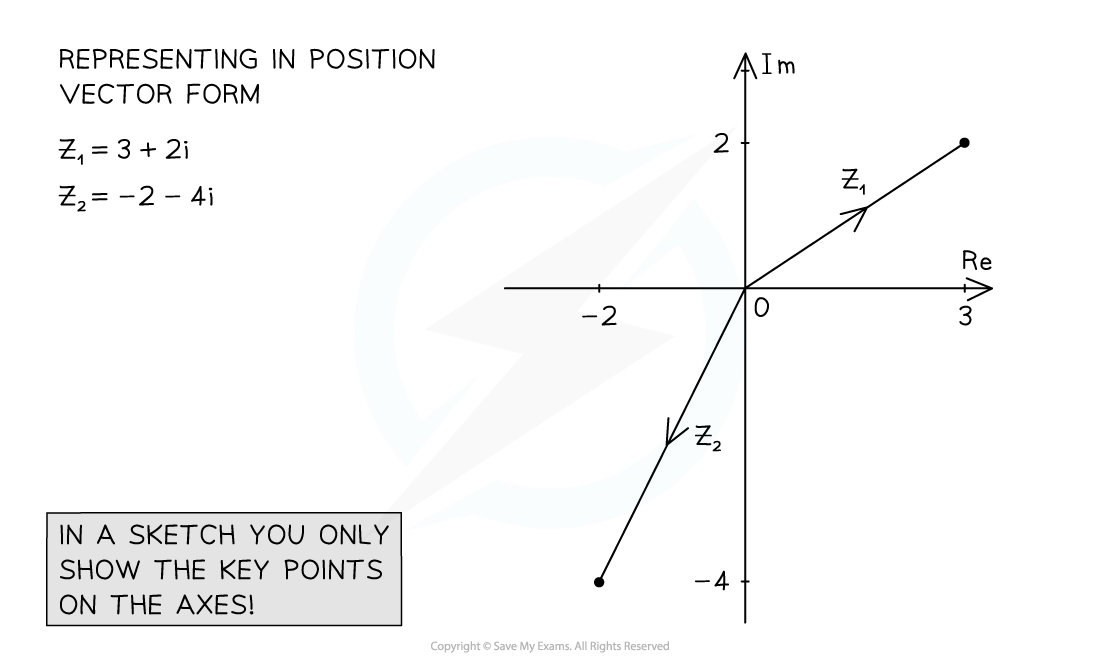
- An Argand diagram is a geometrical way to represent complex numbers as either a point or a vector in two-dimensional space
- We can represent the complex number
 by the point with cartesian coordinate
- We can represent the complex number
- The real component is represented by points on the x-axis, called the real axis, Re
- The imaginary component is represented by points on the y-axis, called the imaginary axis, Im


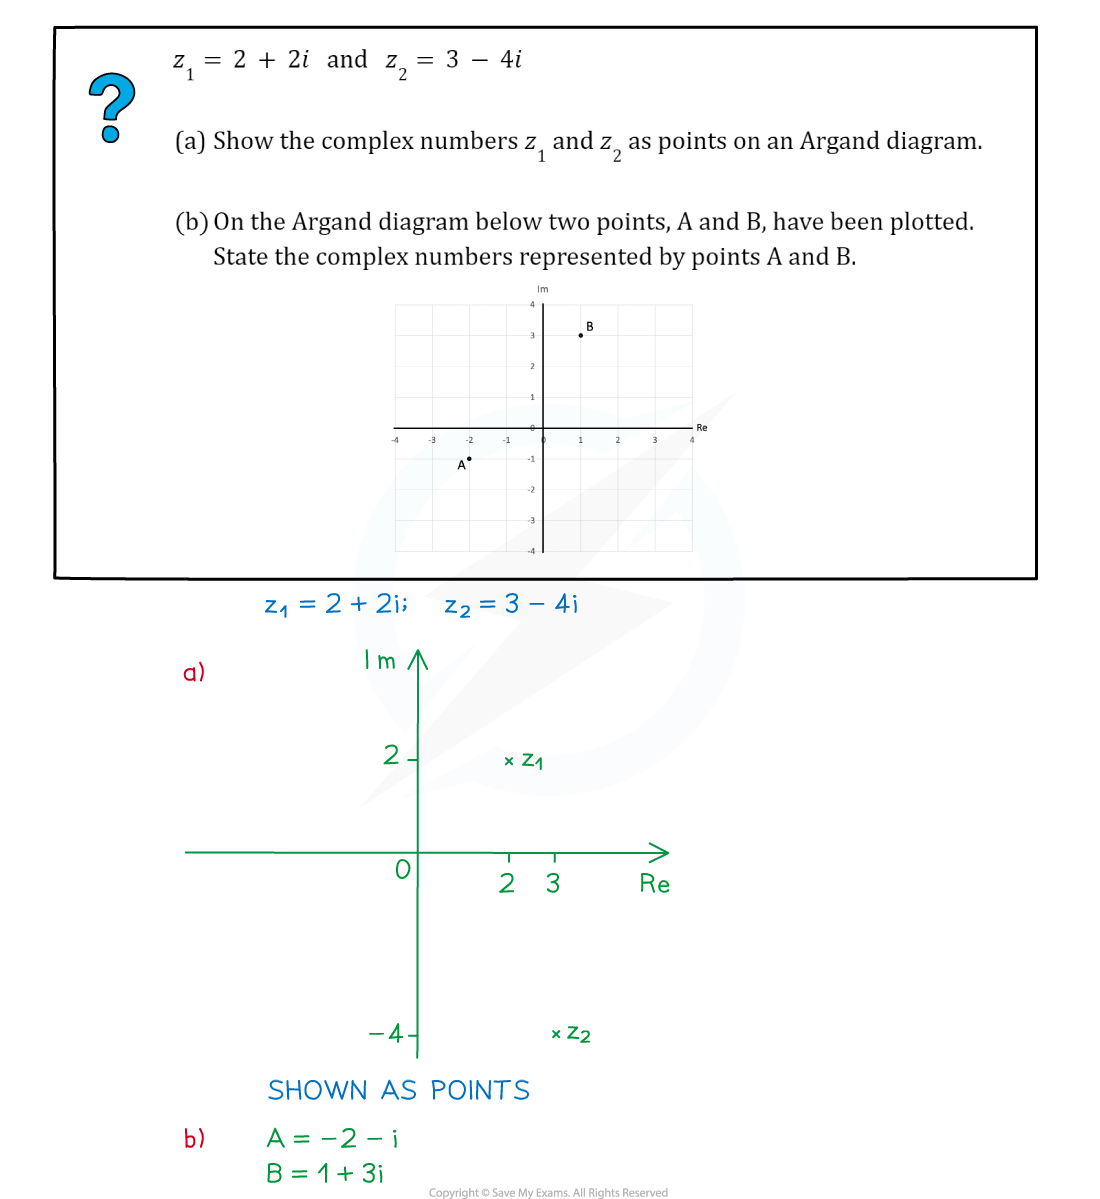
- You may be asked to show roots of an equation in an Argan diagram
- First solve the equation
- Draw a quick sketch, only adding essential information to the axes
- Plot the points and label clearly
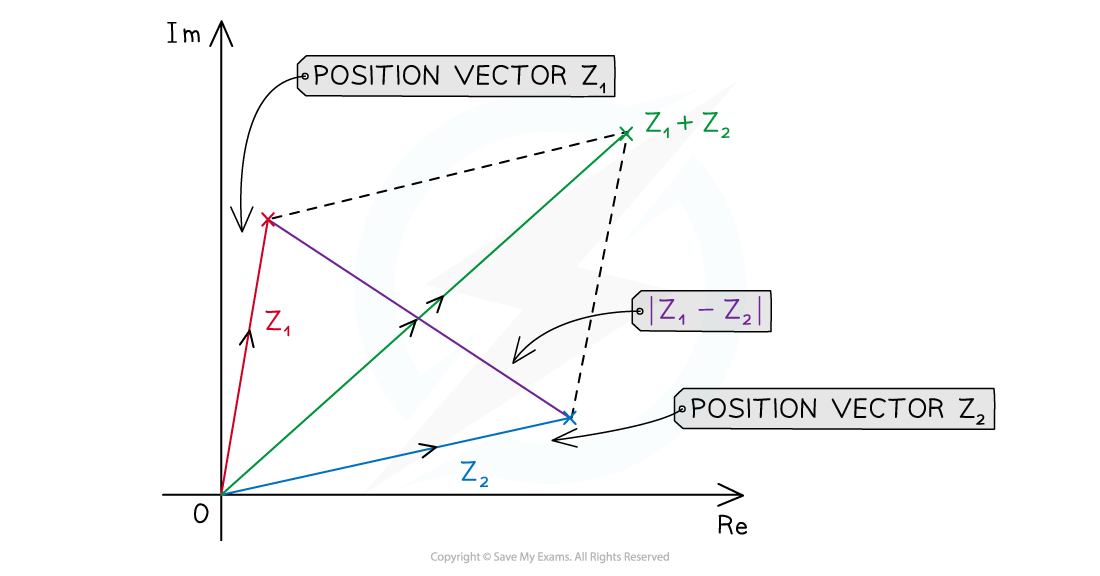
How can I use an Argand diagram to visualise |z1 + z2| and |z1 - z2|?
- Plot two complex numbers z1 and z2
- Draw a line from the origin to each complex number
- Form a parallelogram using the two lines as two adjacent sides
- The modulus of their sum |z1 + z2| will be the length of the diagonal of the parallelogram starting at the origin
- The modulus of their difference |z1 - z2| will be the length of the diagonal between the two complex numbers

Worked Example

Exam Tip
- When setting up an Argand diagram you do not need to draw a fully scaled axes, you only need the essential information for the points you want to show, this will save a lot of time.
转载自savemyexams


最新发布
© 2025. All Rights Reserved. 沪ICP备2023009024号-1


