- 翰林提供学术活动、国际课程、科研项目一站式留学背景提升服务!
- 400 888 0080
CIE A Level Maths: Probability & Statistics 2复习笔记3.3.1 Normal Hypothesis Testing
Normal Hypothesis Testing
What steps should I follow when carrying out a hypothesis test for the mean of a normal distribution?
- Following these steps will help when carrying out a hypothesis test for the mean of a normal distribution:
 Step 2. Write the null and alternative hypotheses clearly
- Step 3. Assuming the null hypothesis to be true, define the statistic
- Step 4. Calculate either the critical value(s) or the probability of the observed value for the test
- Step 5. Compare the observed value of the test statistic with the critical value(s) or the probability with the significance level
- Or compare the z-value corresponding to the observed value with the z-value corresponding to the critical value
- Step 6. Decide whether there is enough evidence to reject H0 or whether it has to be accepted
- Step 7. Write a conclusion in context
How should I define the distribution of the population mean and the statistic?
- The population parameter being tested will be the population mean, μ in a normally distributed random variable N (μ, σ2)
How should I define the hypotheses?
- A hypothesis test is used when the value of the assumed population mean is questioned
- The null hypothesis, H0 and alternative hypothesis, H1 will always be given in terms of µ
- Make sure you clearly define µ before writing the hypotheses, if it has not been defined in the question
- The null hypothesis will always be H0 : µ = ...
- The alternative hypothesis will depend on if it is a one-tailed or two-tailed test
- A one-tailed test would test to see if the value of µ has either increased or decreased
- The alternative hypothesis, H1 will be H1 : µ > ... or H1 : µ < ...
- A two-tailed test would test to see if the value of µ has changed
- The alternative hypothesis, H1 will be H1 : µ ≠ ..
How should I define the statistic?
- The population mean is tested by looking at the mean of a sample taken from the population

- the mean of the sample mean distribution will be the same as the mean of the population distribution
How should I carry out the test?
- The hypothesis test can be carried out by
- either calculating the probability of a value taking the observed or a more extreme value and comparing this with the significance level
-
-
-
 This is sometimes known as your test statistic
-
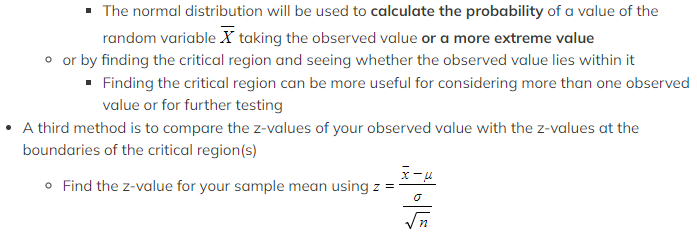
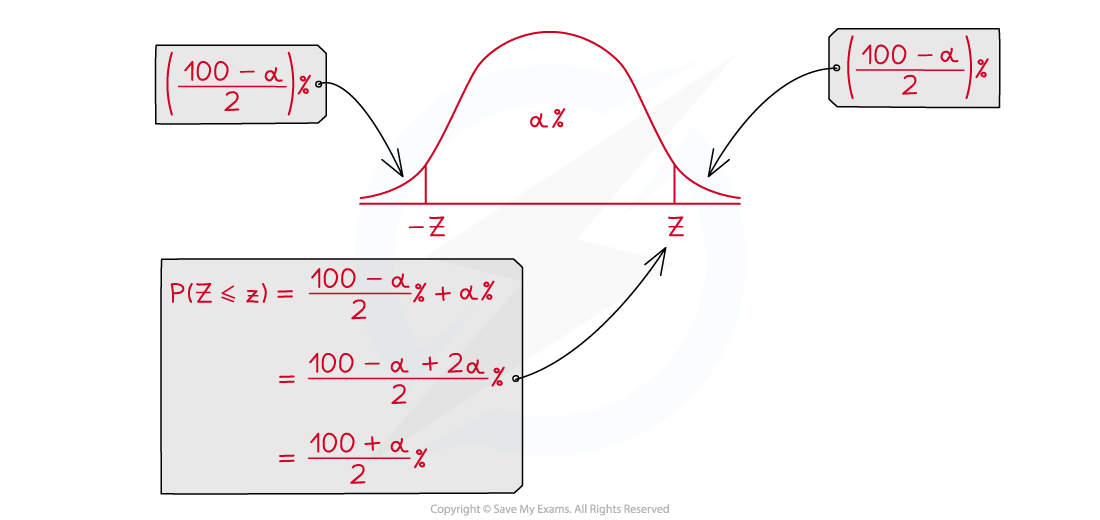
- Use the table of critical values to find the z-value for the significance level
- If the z-value for your test statistic is further away from 0 than the critical z-value then reject H0
-
How is the critical value found in a hypothesis test for the mean of a normal distribution?
- The critical value(s) will be the boundary of the critical region
- The probability of the observed value being within the critical region, given a true null hypothesis will be the same as the significance level


- To find the critical value(s) use the standard normal distribution:
- Step 1. Find the distribution of the sample means, assuming H0 is true
 If using this method for a two-tailed test be aware of the following:
- The symmetry of the normal distribution means that the z - values will have the same absolute value
- You can solve the equation for both the positive and negative z – value to find the two critical values
- Check that the two critical values are the same distance from the mean
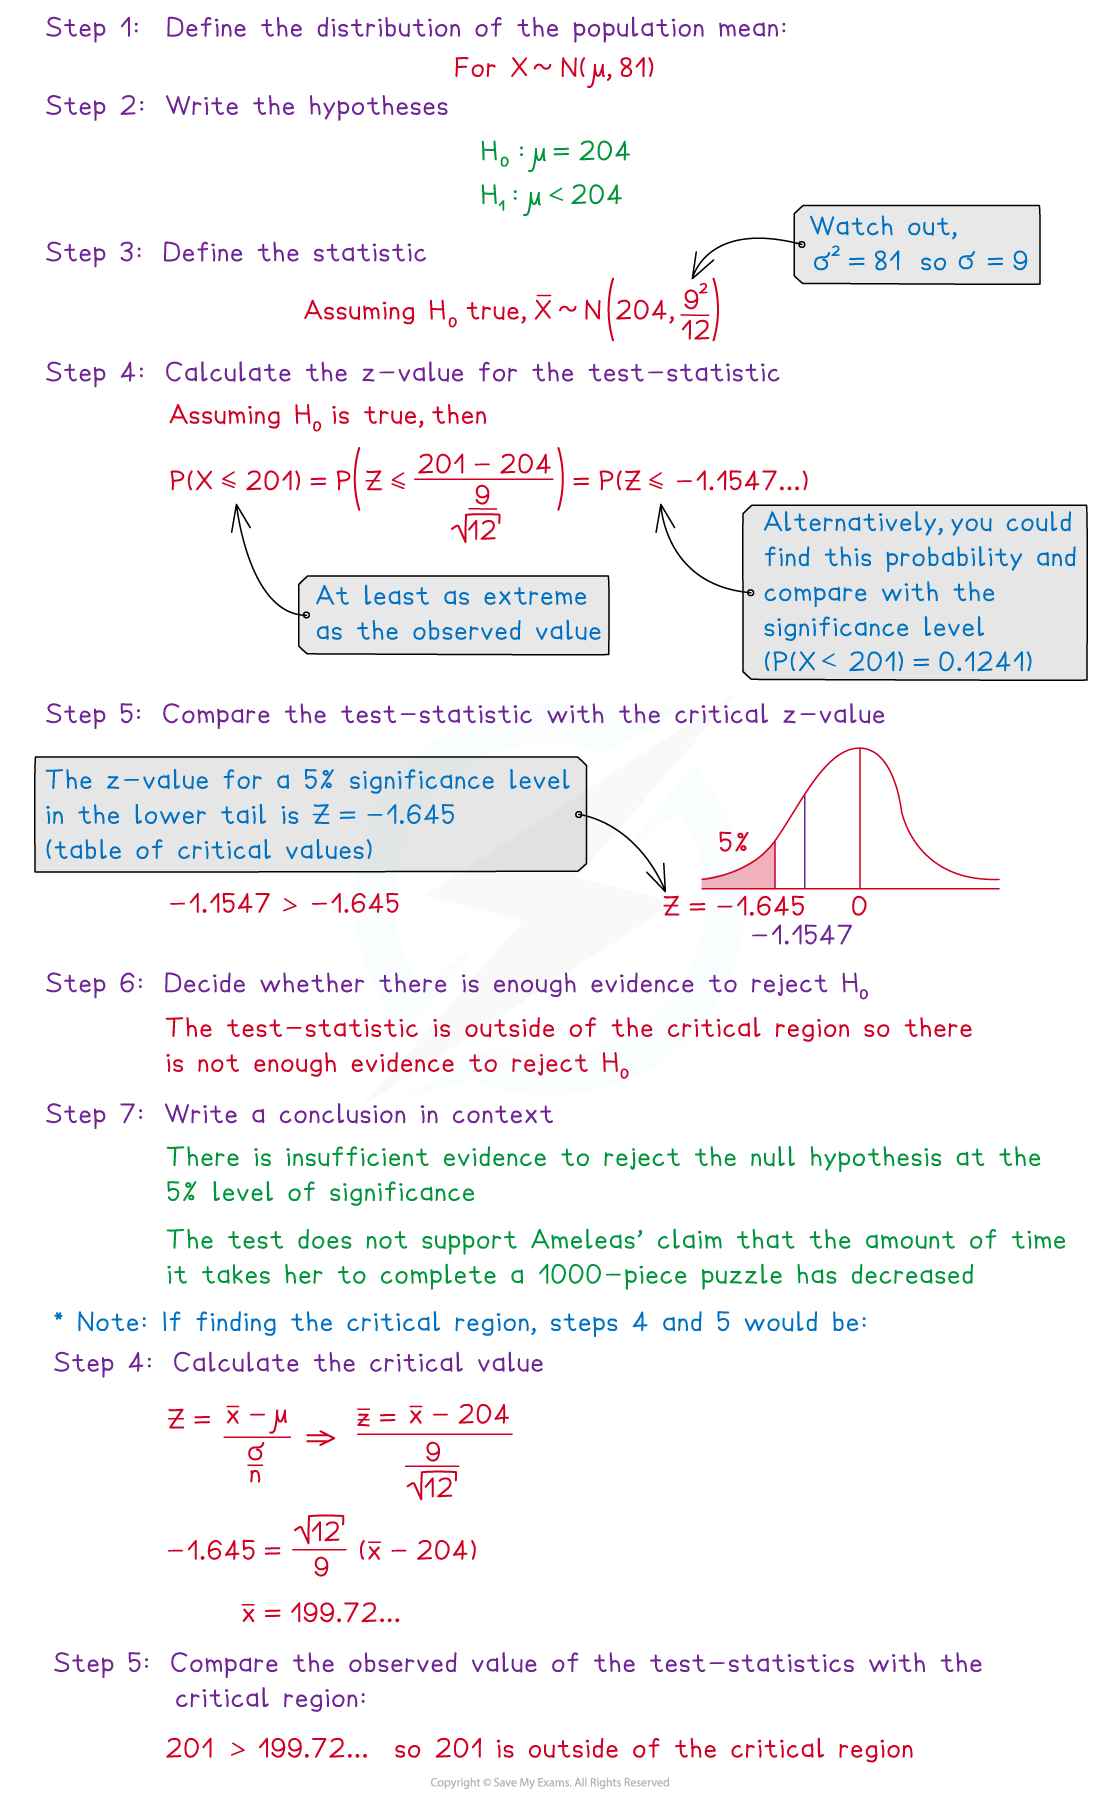
Worked Example


Exam Tip
-
Use a diagram to help, especially if looking for the critical value and comparing this with an observed value of a test statistic or if working with z-values.
转载自savemyexams

早鸟钜惠!翰林2025暑期班课上线

最新发布
© 2025. All Rights Reserved. 沪ICP备2023009024号-1


