- 翰林提供学术活动、国际课程、科研项目一站式留学背景提升服务!
- 400 888 0080
CIE A Level Maths: Probability & Statistics 2复习笔记2.3.1 Probability Density Function
Calculating Probabilities using PDF
What is a probability density function (p.d.f.)?
- For a continuous random variable , it is often possible to model probabilities using a function
- This function is called a probability density function (p.d.f.)
 The graph does not need to start and end on the x-axis

 How do I find probabilities using a probability density function (p.d.f.)?
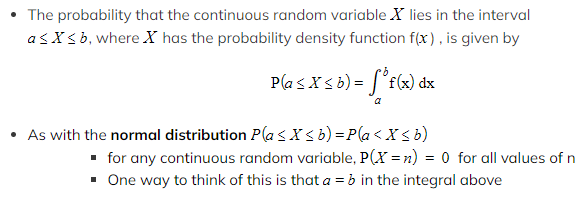 How do I solve problems using the PDF?
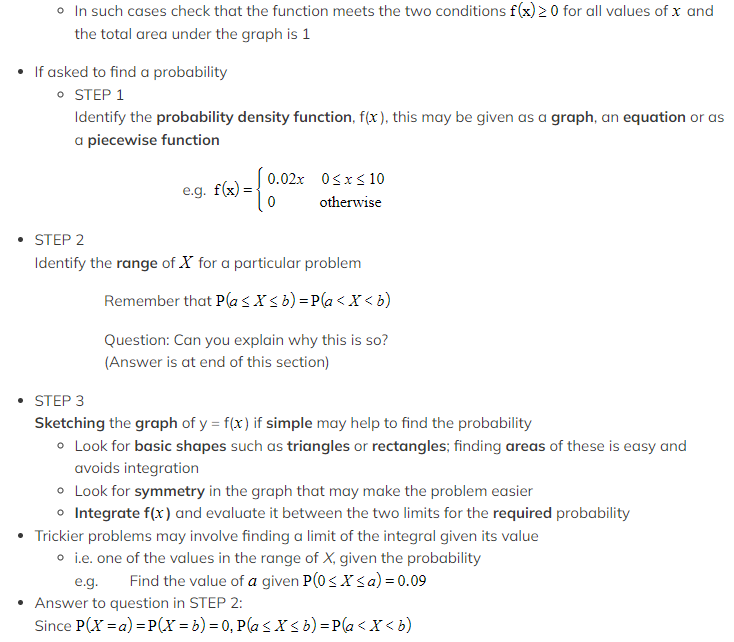
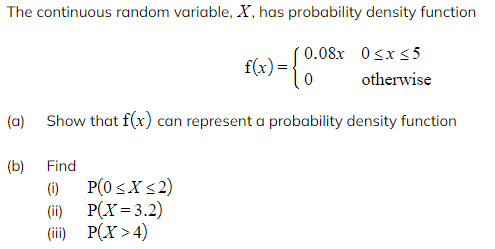
- Some questions may ask for justification of the use of a given function for a probability density function
 Worked Example
![]()

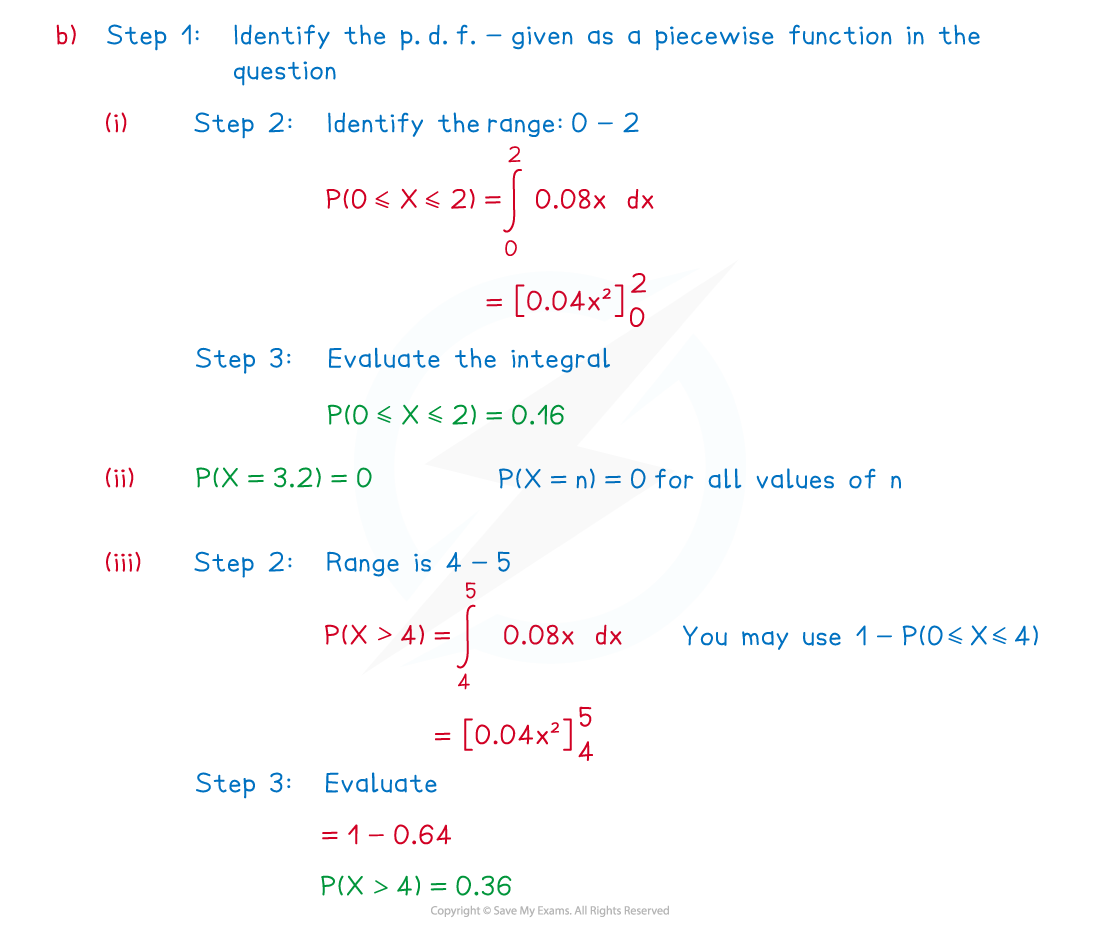
Exam Tip
- If the graph is easy to draw, then a sketch of f(x) is helpful
- This can highlight useful features such as the graph (and so probabilities) being symmetrical
- Some p.d.f. graphs lead to common shapes such as triangles or rectangles whose areas are easy to find, avoiding the need for integration
Median and Mode of a CRV
What is meant by the median of a continuous random variable?
 How do I find the median of a continuous random variable?
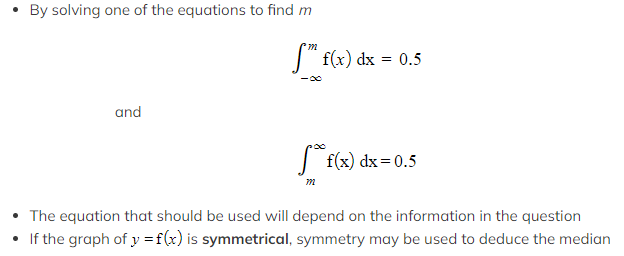 How do I find quartiles (or percentiles) of a continuous random variable?
- In a similar way, to find the median
- The lower quartile will be the value L such that P(X ≤ L) = 0.25 or
P(X ≥ L) = 0.75 - The upper quartile will be the value U such that P(X ≤ U) = 0.75 or
P(X ≥ U) = 0.25
- The lower quartile will be the value L such that P(X ≤ L) = 0.25 or
- Percentiles can be found in the same way
- The 15th percentile will be the value k such that P(X ≤ k) = 0.15 or
P(X ≥ k) = 0.85
- The 15th percentile will be the value k such that P(X ≤ k) = 0.15 or
What is meant by the mode of a continuous random variable?
- The mode of a continuous random variable, X , with probability density function f(x) is the value of x that produces the greatest value of f(x) .
How do I find the mode of a PDF?
- This will depend on the type of function f(x); the easiest way to find the mode is by considering the shape of the graph of f(x)
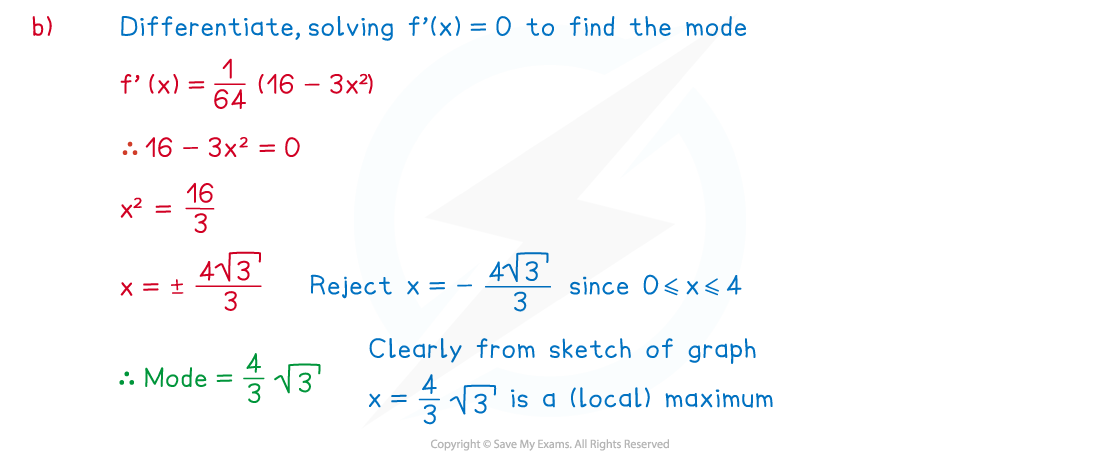
- If the graph is a curve with a (local) maximum point, the mode can be found by differentiating and solving the equation f'(x) = 0
- If there is more than one solution to f'(x) = 0 , further work may be needed to deduce which answer is the mode
- Look for valid values of from the definition of the p.d.f.
- Use the second derivative (f'' (x) ) to deduce the nature of each stationary point
- You may need to check the values of f(x) at the endpoints too
- If there is more than one solution to f'(x) = 0 , further work may be needed to deduce which answer is the mode
- If the graph of y = f(x) is symmetrical, symmetry may be used to deduce the mode
- For a symmetrical p.d.f. median = mode = mean
(See E(X) & Var (X) (continuous) for the mean)
Worked Example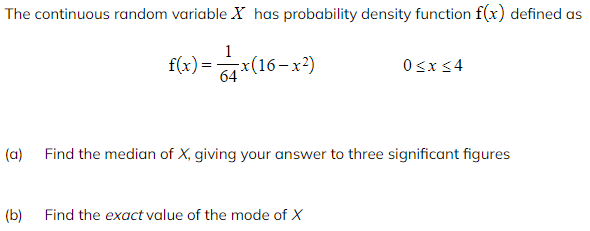 (a)Find the median of X, giving your answer to three significant figures
(b)Find the exact value of the mode of X
(a)Find the median of X, giving your answer to three significant figures
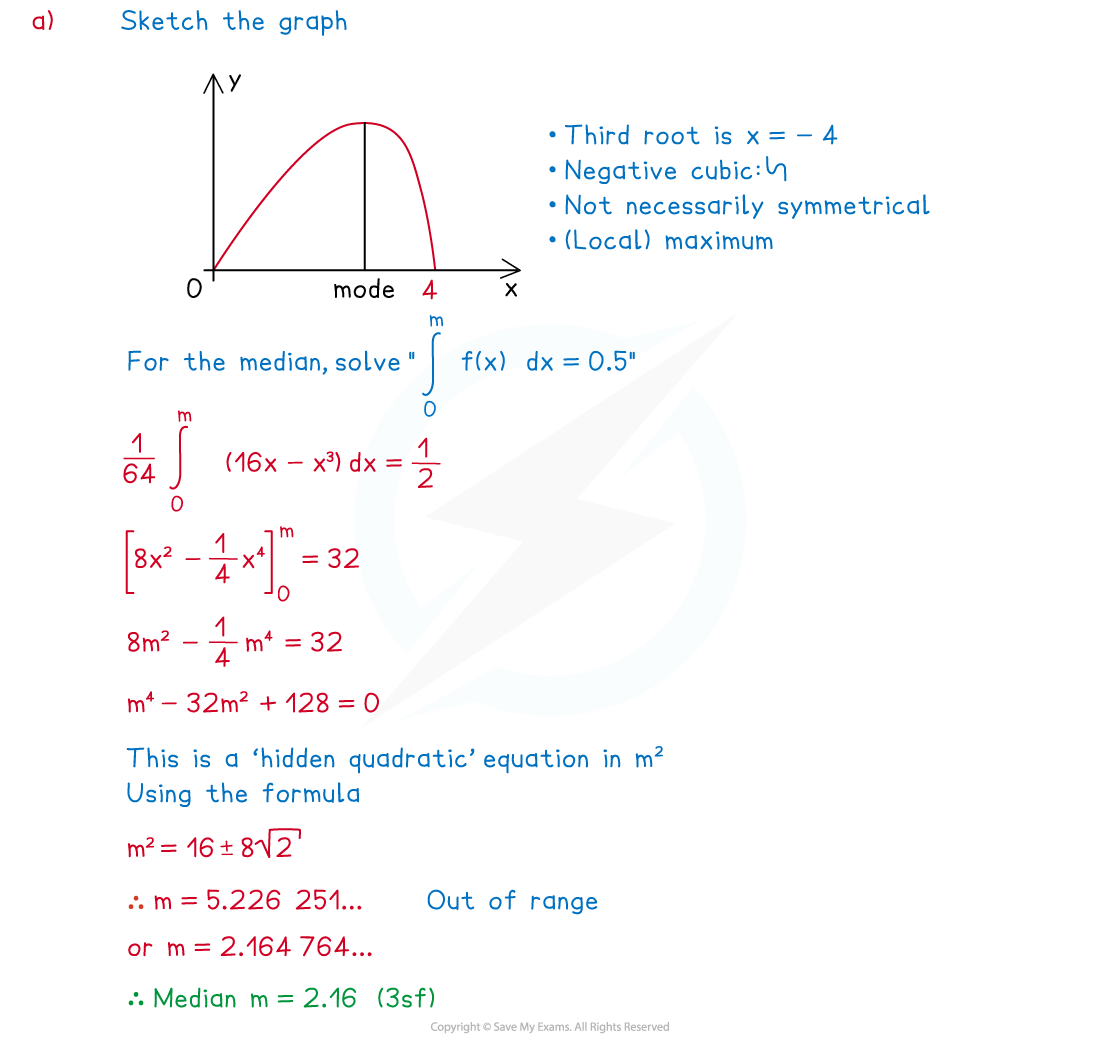
(b)Find the exact value of the mode of X
Exam Tip
- Avoid spending too long sketching the graph of y = f(x), only do this if the graph is straightforward as finding the median and mode by other means can be just as quick
转载自savemyexams

早鸟钜惠!翰林2025暑期班课上线

最新发布
© 2025. All Rights Reserved. 沪ICP备2023009024号-1


