- 翰林提供学术活动、国际课程、科研项目一站式留学背景提升服务!
- 400 888 0080
CIE A Level Maths: Probability & Statistics 2复习笔记1.2.3 Confidence Intervals
Confidence Interval for μ
What is a confidence interval?
- It is impossible to find the exact value of a population parameter when taking a sample
- The best we can do is find an interval for which the exact value is likely to lie within
- This is called a confidence interval
- The confidence level of a confidence interval is the probability that the interval contains the population parameter
- Be careful with wording – the population parameter is a fixed value so it does not make sense to talk about the probability that it lies within an interval
- Instead we talk about the probability an interval contains the parameter
- Suppose samples were collected and a 95% confidence interval for a population parameter was constructed for each sample, then for every 100 intervals we would expect on average 95 of them to contain the parameter
- 95 out of 100 is not guaranteed – it is possible all of them could contain the parameter
- It is possible (though very unlikely) that none of them contains the parameter
- Be careful with wording – the population parameter is a fixed value so it does not make sense to talk about the probability that it lies within an interval
What affects the width of a confidence interval?
- The width of a confidence interval is the range of the values in the interval
- The confidence level affects the width
- Increasing the confidence level will increase the width
- Decreasing the confidence level will decrease the width
- The size of the sample affects the width
- Increasing the sample size will decrease the width
- Decreasing the sample size will increase the width
How do I calculate a confidence interval for the population mean (μ)?
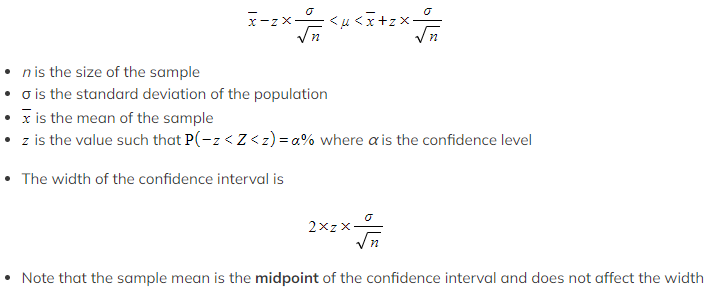
- For this course we only construct symmetrical confidence intervals for the mean of a population when:
- The variance of the population is known
- The population follows a normal distribution
- The population does not follow a normal distribution but the sample size is big enough to use the Central Limit Theorem
- The confidence interval can be found using the formula
How do I find the z-value for a confidence interval?
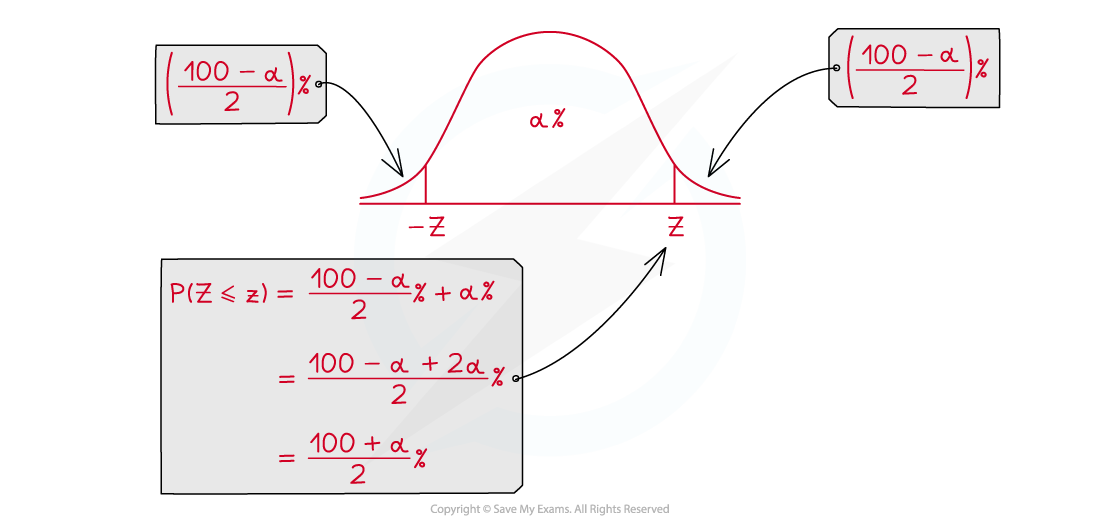
- The z-values for common confidence levels are:
-
 z-values for most confidence intervals you will need to work with will be given in the table of critical values
-
How can I interpret a confidence interval?
- After you have calculated a confidence interval for μ you might be expected to comment on the possibility of μ being a specific value
- If the value which is claimed to be μ is within the confidence interval then there is evidence to support the claim
- If the value is outside the interval then there is not enough evidence to support the claim
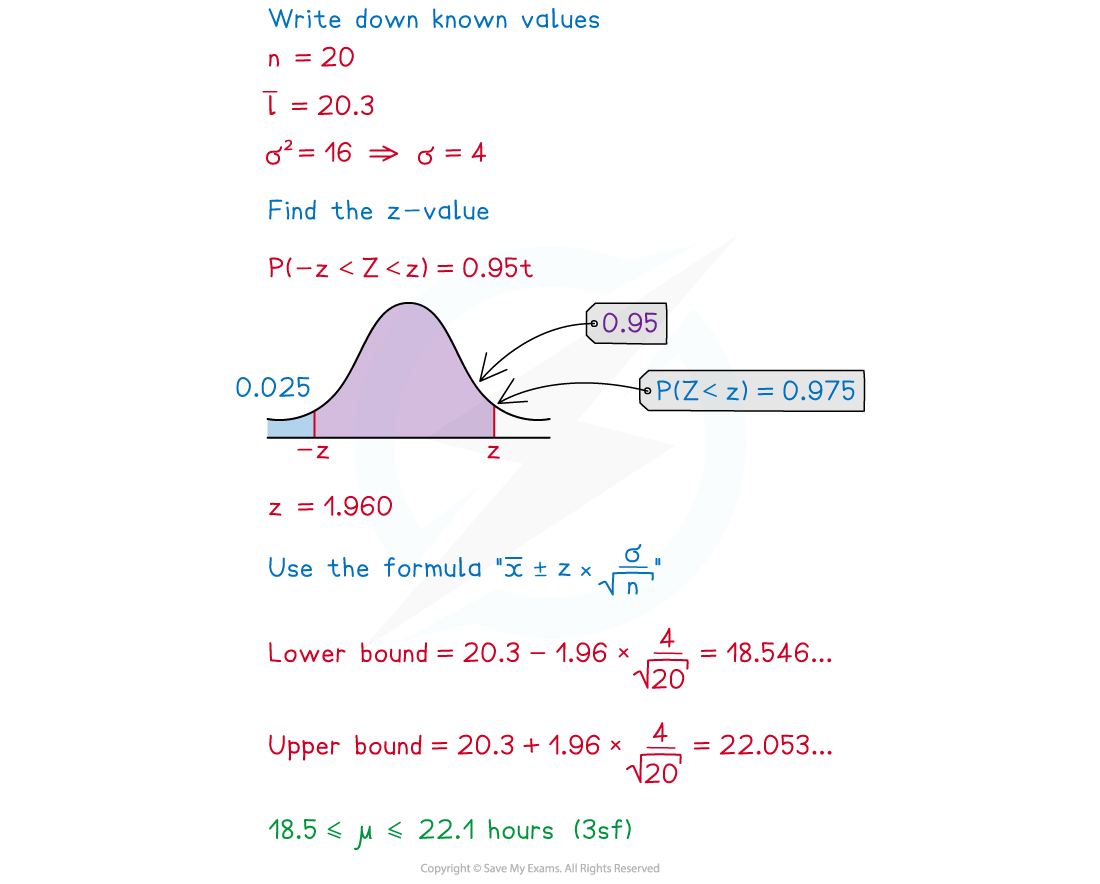
Worked Example
Exam Tip
- Always check whether the population follows a normal distribution, if it does not then you will have to state that the Central Limit Theorem is being used (as the sample size should be big enough). Take care with the fiddly bits:
- You need to square-root the sample size
- You need to use the standard deviation so you might also need to square-root the variance
Confidence Interval for p
How do I calculate a confidence interval for the proportion (p) of a population?
- If we want to find estimate the proportion of a population that fulfil a certain criteria we can construct a confidence interval based on the proportion of a sample who fulfil that criteria
- The proportion is between 0 and 1
- For this course we only construct symmetrical confidence intervals for the proportion of a population provided that the sample size is large enough to use the Central Limit Theorem
- The confidence interval can be found using the formula
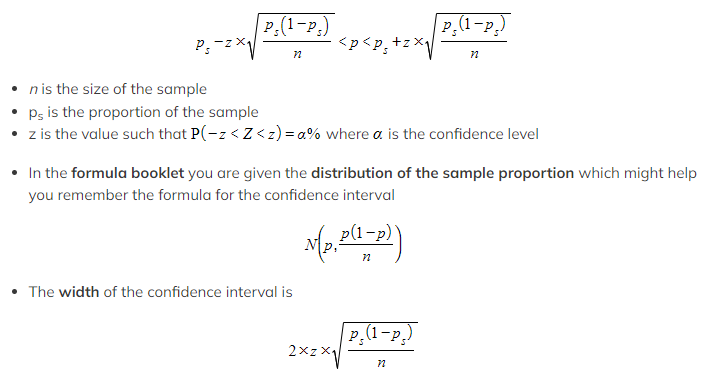
- Note that the sample proportion is the midpoint of the confidence interval but it also affects the width
How can I interpret a confidence interval?
- Interpreting a confidence interval for p works in the same way as a confidence interval for μ
- The only additional part is that you might get asked to see whether an experiment is fair
- Find the probability of the outcome as though it were fair
- For example – a fair coin will have a 0.5 chance of landing on each side
- Use a sample to calculate a confidence interval
- See if the probability is in the confidence interval
- If it is not then there is sufficient evidence to suggest that the experiment is not fair
- Find the probability of the outcome as though it were fair
Worked Example
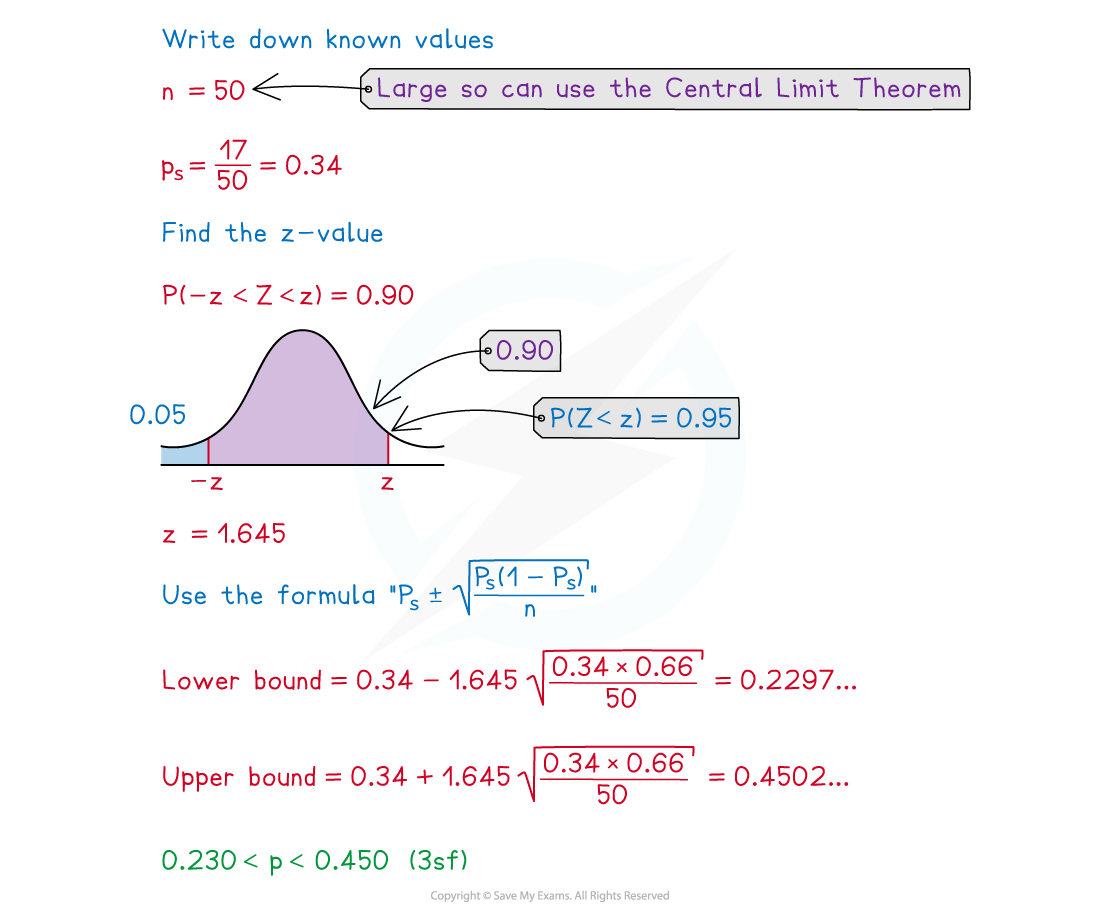
Misty selects 50 fish at random from a lake. 17 of the 50 fish are trout.
Calculate a 90% confidence interval for the proportion of the fish in the lake that are trout.
Exam Tip
- Remember that the confidence interval is not guaranteed to contain the true population proportion. When interpreting your answers use phrases like “there is evidence to support...”.
转载自savemyexams

最新发布
© 2026. All Rights Reserved. 沪ICP备2023009024号-1


