- 翰林提供学术活动、国际课程、科研项目一站式留学背景提升服务!
- 400 888 0080
CIE A Level Maths: Probability & Statistics 1复习笔记3.3.2 Standard Normal Distribution
Standard Normal Distribution
What is the standard normal distribution?
- The standard normal distribution is a normal distribution where the mean is 0 and the standard deviation is 1
- It is denoted by Z
 Why is the standard normal distribution important?
- Calculating probabilities for the normal distribution can be difficult and lengthy due to its complicated probability density function
- The probabilities for the standard normal distribution have been calculated and laid out in the table of the normal distribution which can be found in your formula booklet
- Nowadays, many calculators can calculate probabilities for any normal distribution, if yours does it is a good idea to learn how to use it to check your answers but you must still use the tables of the normal distribution and show all your working clearly
- It is possible to map any normal distribution onto the standard normal distribution curve
- Mapping different normal distributions to the standard normal distribution allows distributions with different means and standard deviations to be compared with each other
How is any normal distribution mapped to the standard normal distribution?
- Any normal distribution curve can be transformed to the standard normal distribution curve by a horizontal translation and a horizontal stretch
 How is the table of the normal distribution function used?
- In your formula booklet you have the table of the normal distribution which provides probabilities for the standard normal distribution
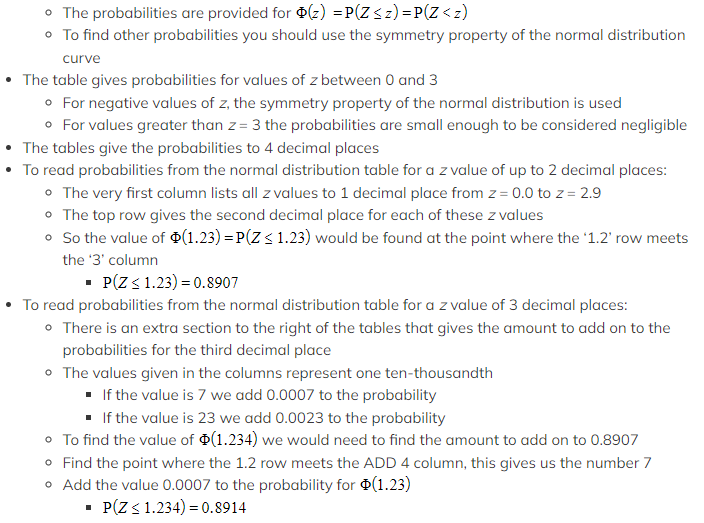
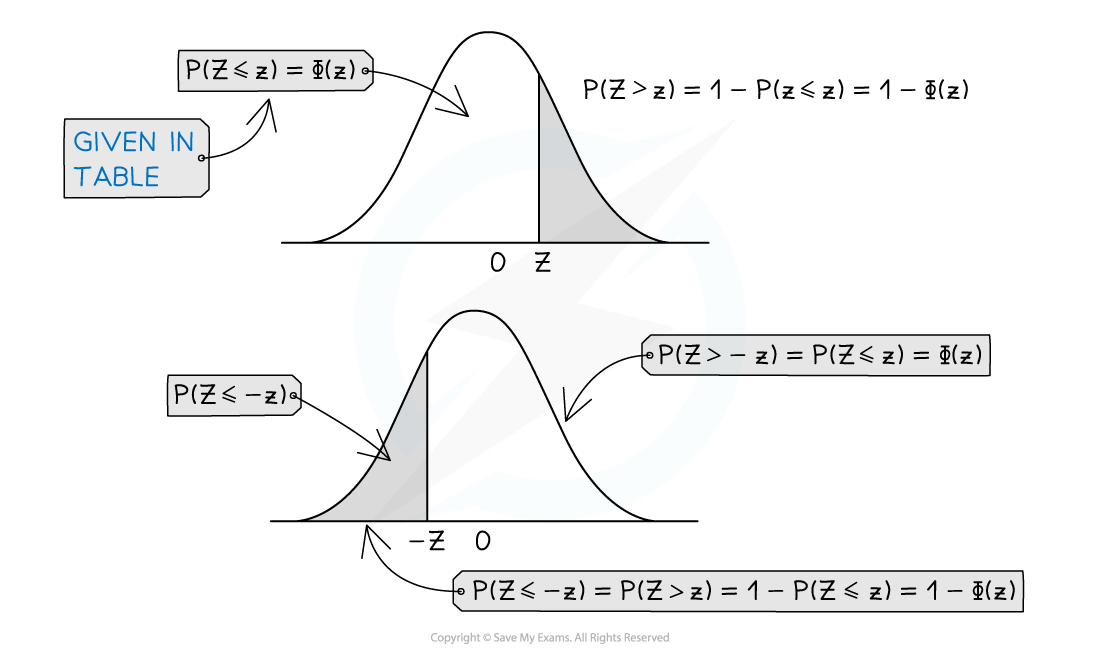
How is the table used to find probabilities that are not listed?
- The property that the area under the graph is 1 allows probabilities to be found for P( Z > z)
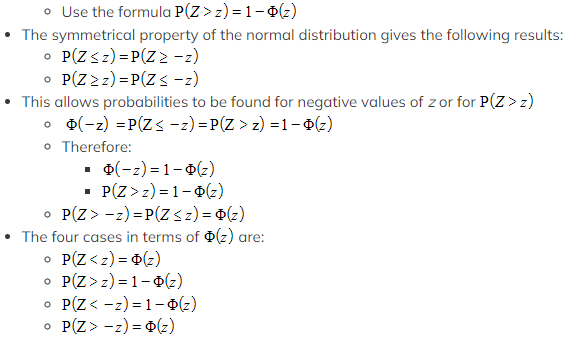 Drawing a sketch of the normal distribution will help find equivalent probabilities
How are z values found from the table of the normal distribution function?
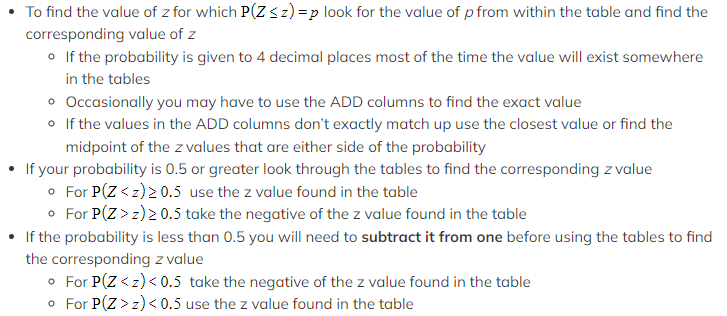 Always draw a sketch so that you can see these clearly
- The formula booklet also contains a table of the critical values of z
- This gives z values to 3 decimal places for common probabilities
- The probabilities in this table are 0.75, 0.9, 0.95, 0.975, 0.99, 0.995, 0.9975, 0.999 and 0.9995
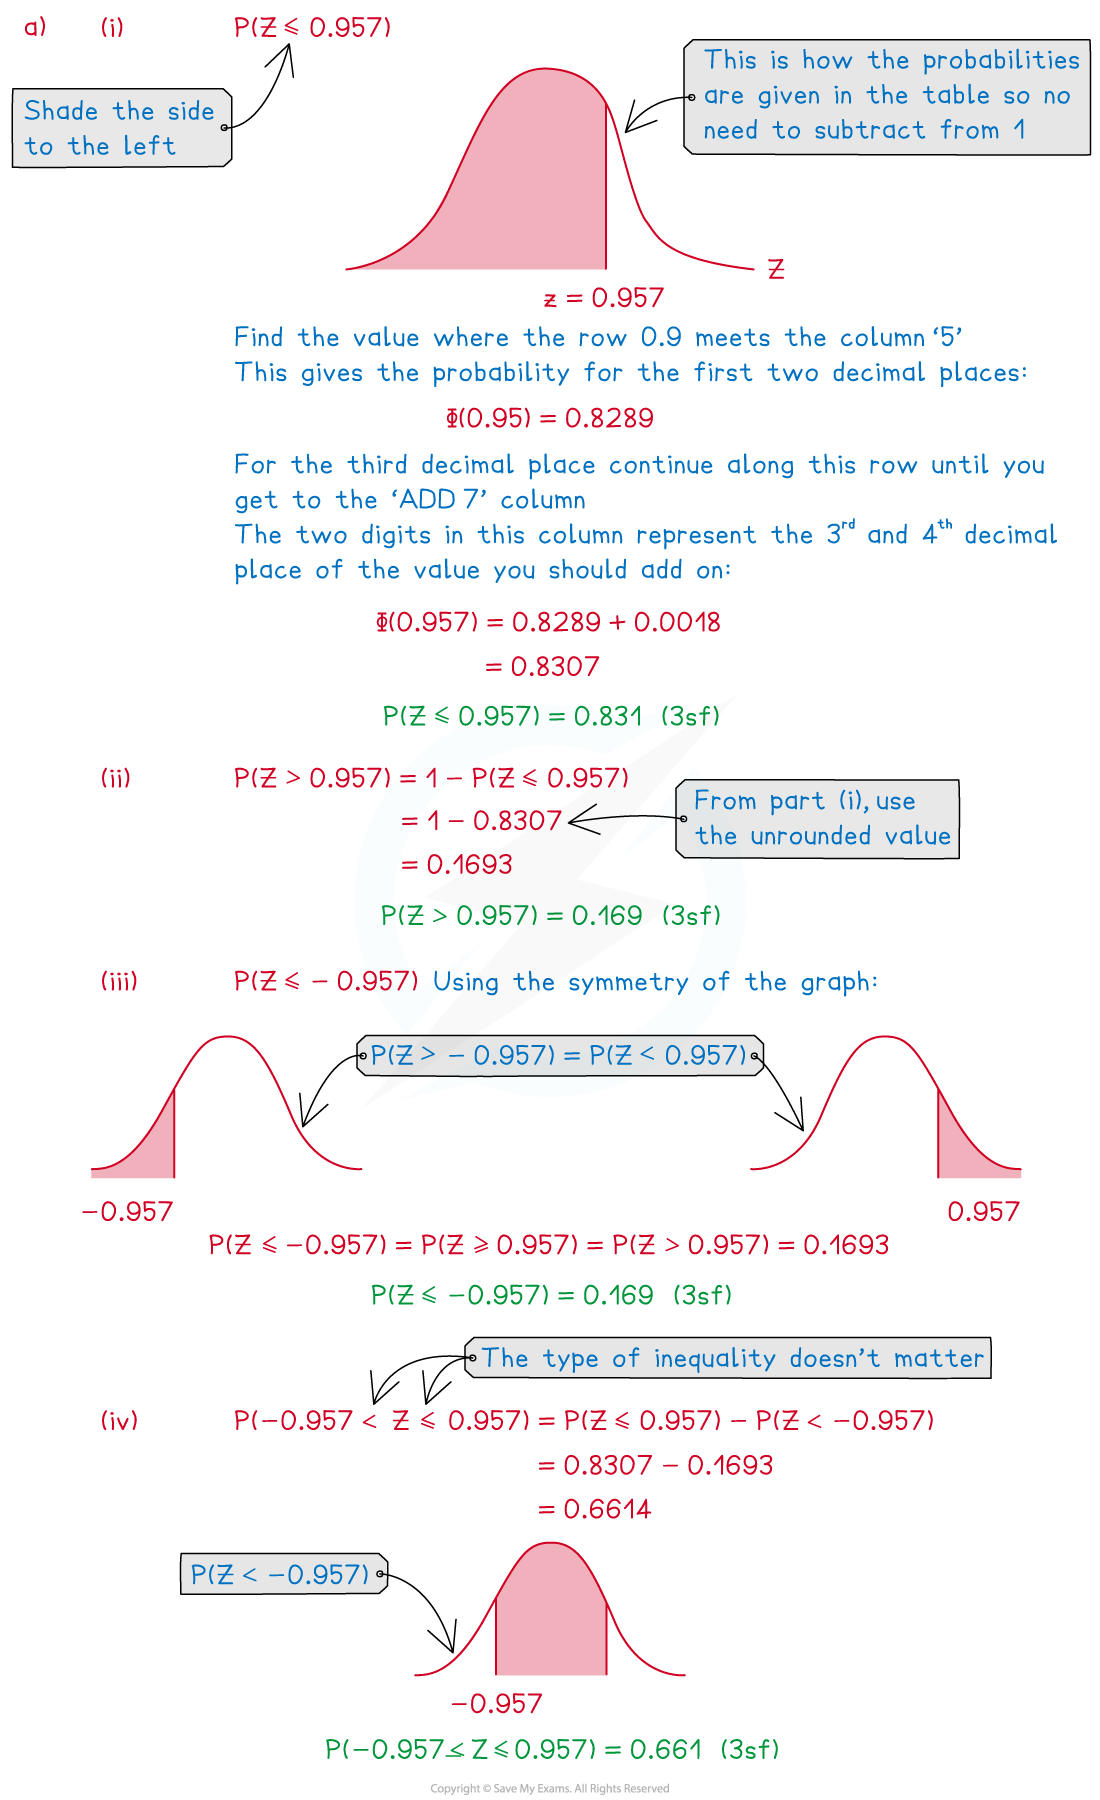
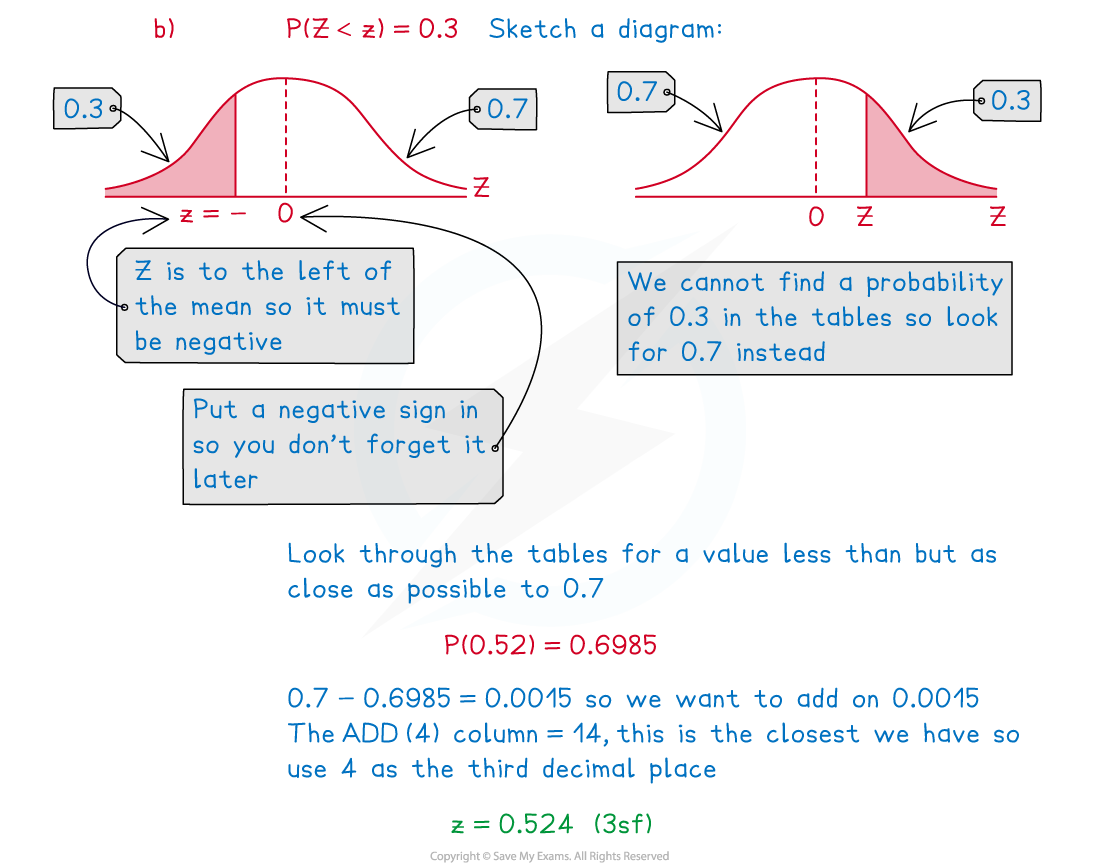
Worked Example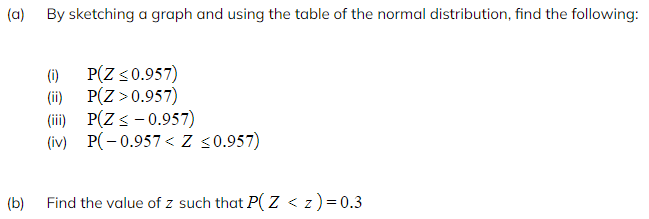
Exam Tip
- A sketch will always help you to visualise the required probability and can be used to check your answer. Check whether the area shaded is more or less than 50% and compare this with your answer.
转载自savemyexams

在线登记
最新发布
© 2025. All Rights Reserved. 沪ICP备2023009024号-1


