CIE A Level Maths: Probability & Statistics 1复习笔记1.2.4 Histograms

Histograms
What is a histogram?
- A histogram is similar to a bar chart but with some key differences
- A histogram is for displaying grouped continuous data whereas a bar chart is for discrete or qualitative data
- There will never be any gaps between the bars of adjacent groups in a histogram
- Whilst in a bar chart the frequency is read from the height of the bar, in a histogram the height of the bar is the frequency density
- On a histogram frequency density is plotted on the y – axis
- This allows a histogram to be plotted for unequal class intervals
- It is particularly useful if data is spread out at either or both ends
- The area of each bar on a histogram will be proportional to the frequency in that class
How do I draw a histogram?
- Step 1. Always check that there are no gaps between the upper boundary of a class and the lower boundary of the next class
- If there are gaps you will need to close them by changing the boundaries before carrying out any calculations
- Consider whether the values are rounded or truncated before closing the gaps
- If there are gaps you will need to close them by changing the boundaries before carrying out any calculations
- Step 2. Find the class width of each group by subtracting the lower boundary from the upper boundary
- Step 3. Calculate the frequency density for each group using the formula:
- Step 4. The histogram will be drawn with the data values on the x – axis and frequency density on the y – axis
- Remember that the scale on both axes must be even, although the class widths may be uneven
- Both axes should be clearly labelled and units included on the x – axis
- Most often, the bars will have different widths
- Remember that the scale on both axes must be even, although the class widths may be uneven
How do we interpret a histogram?
- It is important to remember that the y – axis does not tell us the frequency of each bar in the histogram
- The frequency of a class is found by
 You may be asked to find the frequency of part of a bar within a histogram
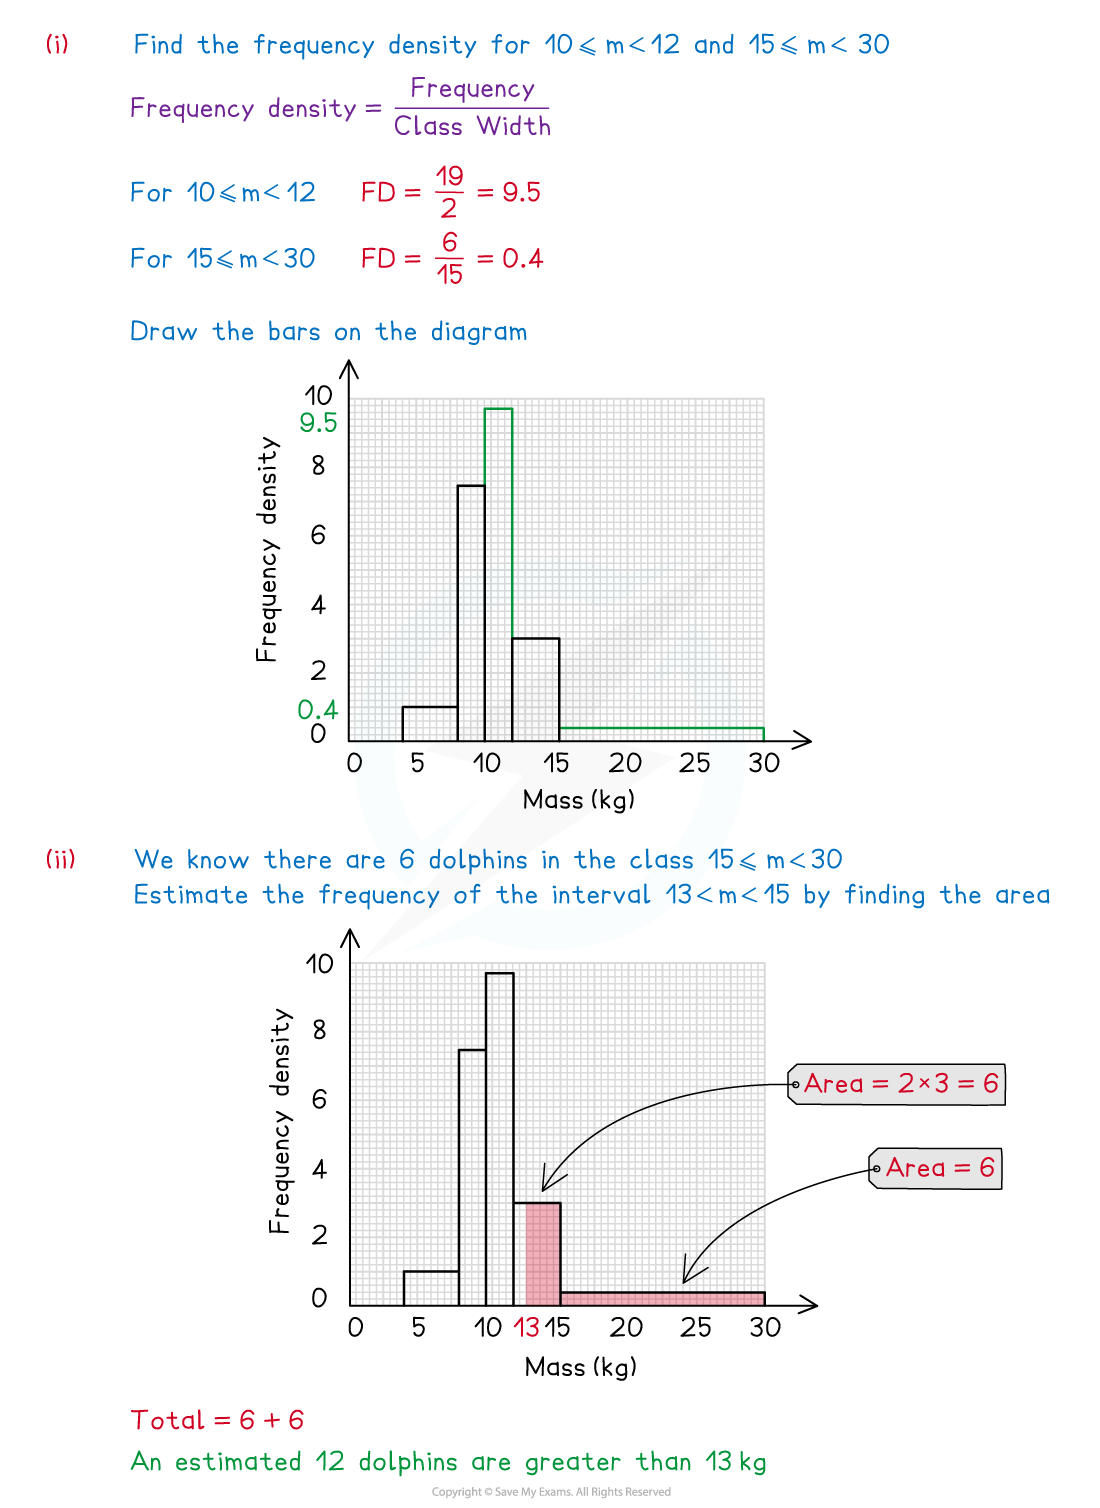
- Find the area of that section of the bar using any information you have already found out
Worked Example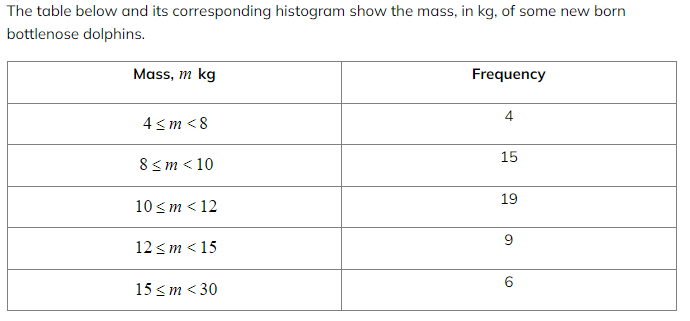
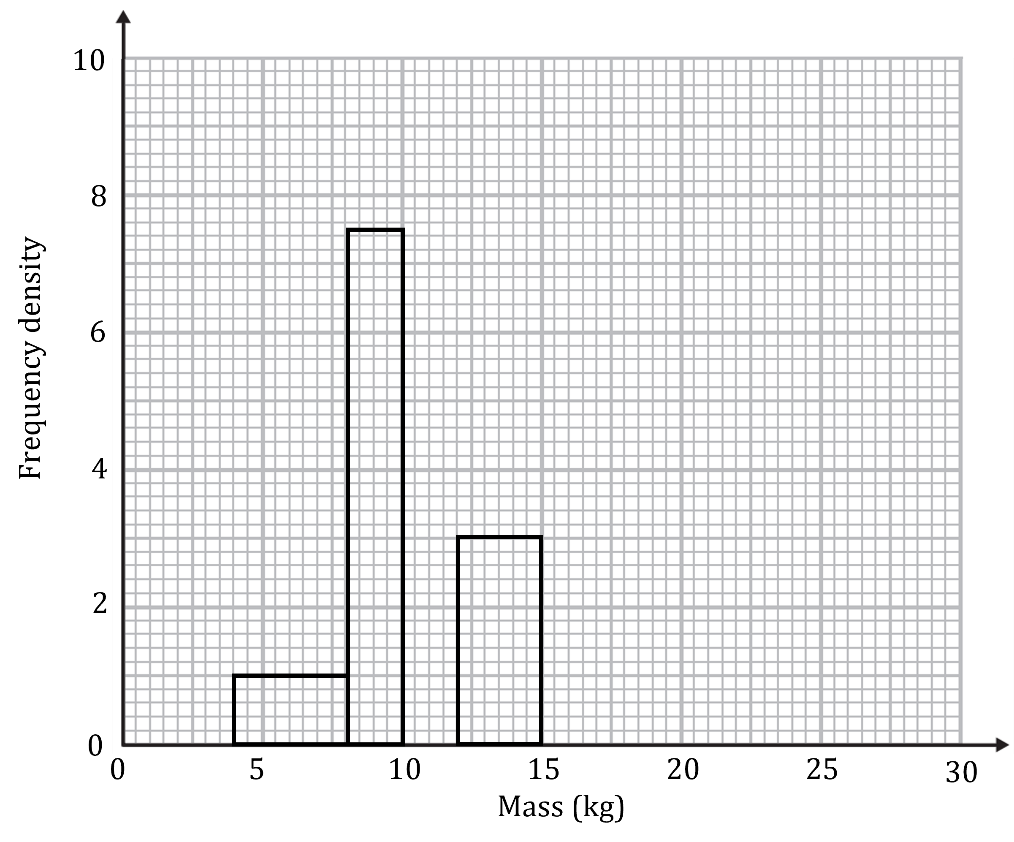
(a)Complete the histogram.
(b)Estimate the number of dolphins whose weight is greater than 13 kg.
Exam Tip
- Look carefully at the scales on the axes, it will rarely be a simple 1 unit to 1 square.
转载自savemyexams

国际竞赛真题资料-点击免费领取!

美高学分项目重磅来袭!立即了解