- 翰林提供学术活动、国际课程、科研项目一站式留学背景提升服务!
- 400 888 0080
CIE A Level Maths: Probability & Statistics 1复习笔记1.1.2 Frequency Tables
Frequency Tables
In most cases in your statistics course, you will come across data that is presented in a frequency table. These allow data to be summarised and make them easier to work with.
Ungrouped Data
A frequency table for ungrouped data shows the frequency of individual data values
Why use a frequency table for ungrouped data?
- When collecting large amounts of raw data, it is quicker to use a tally system and then collate the results into a frequency table
- Ungrouped frequency tables are normally used for numerical, discrete data
- Organising data into a frequency table makes it easier to work with
- Calculating averages, ranges and summary statistics can be done much quicker from a frequency table than from raw data
- It gives a clear pattern of the data
- It is easy to quickly see where most of the data are and to see extreme values
- A frequency table for ungrouped data keeps all of the original data values
- It is still possible to calculate the actual averages, ranges and summary statistics
How are mean, median and mode calculated from an ungrouped frequency table?
- You should already be familiar with finding the mean, median and mode from raw, ungrouped data
- The mode is the value that occurs most often in a data set
- In an ungrouped frequency table the data value with the highest frequency will be the mode
- The median is the middle value when the data is in order of size
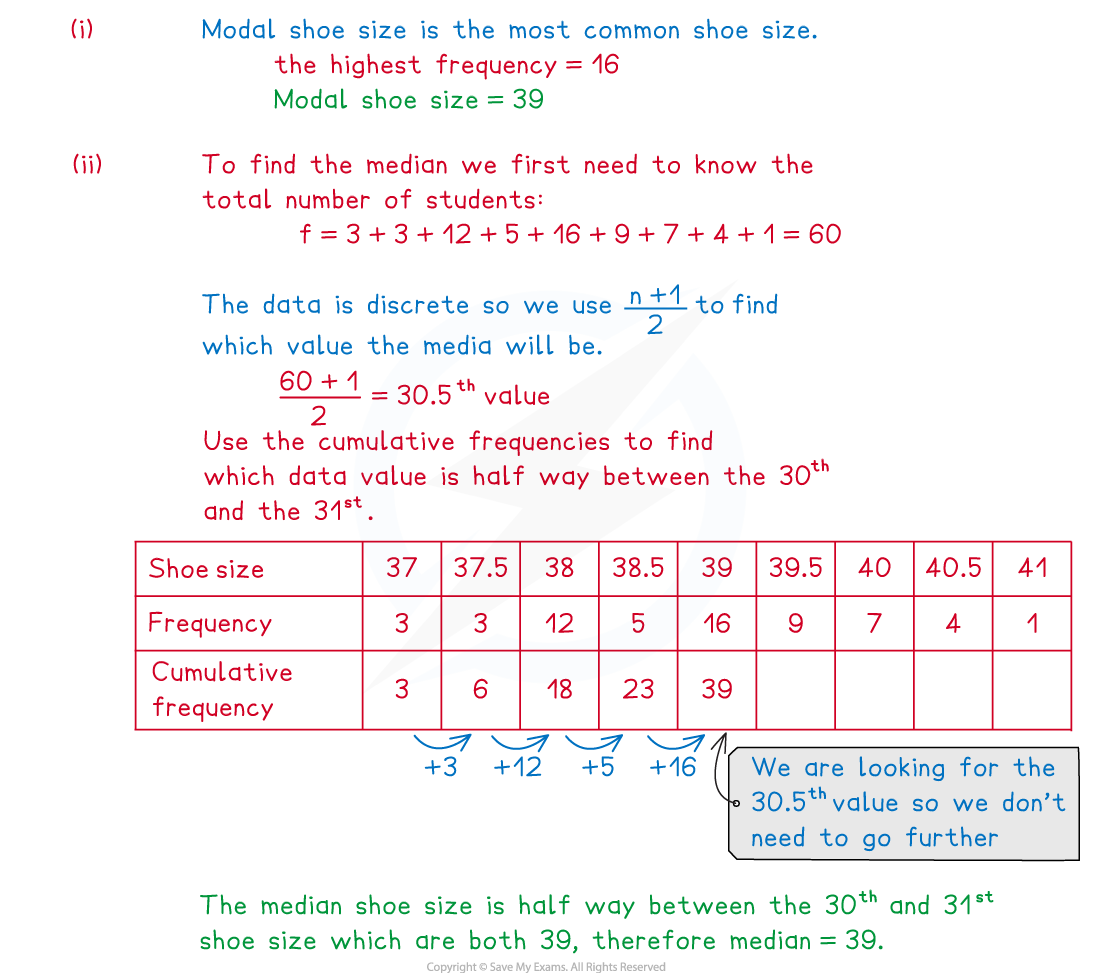
- To find the median from an ungrouped frequency table, add the frequencies together until you reach the value that is half of the total
 Worked Example
The frequency table below gives information about the shoe size of a group of year 12 students.
| Shoe Size | 37 | 37.5 | 38 | 38.5 | 39 | 39.5 | 40 | 40.5 | 41 |
| Frequency | 3 | 3 | 12 | 5 | 16 | 9 | 7 | 4 | 1 |
(i)Write down the modal shoe size.
(ii)Explain how you know that the median shoe size is 39.
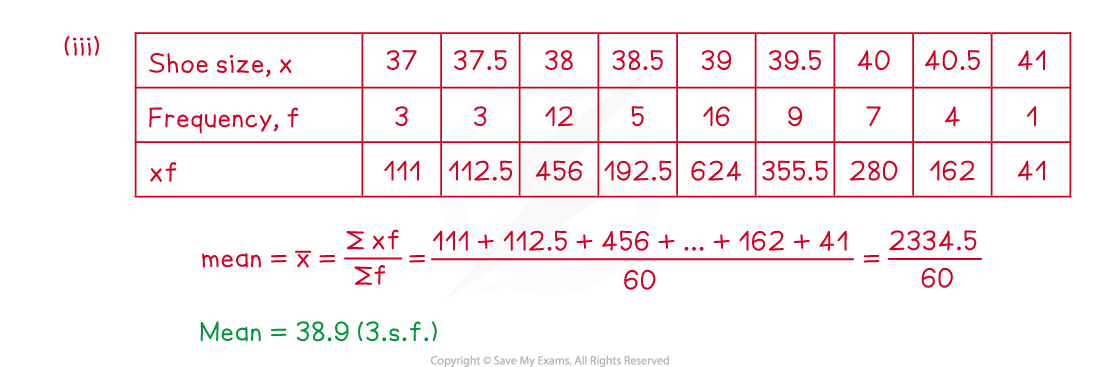
(iii)Calculate the mean shoe size.
Exam Tip
- Use common sense when checking your answers, is your mean within the range of the data? Does is seem right? A mean of 140 for example could not be correct if the data is about ages of students taking an exam at university.
Grouped Data
A frequency table for grouped data is usually used for large amounts of continuous data. They shows the frequency of data values that are within a particular group or class.
What are the advantages and disadvantages of grouping data?
- Grouping data is especially useful when data can take a large range of different values
- Trends and patterns can be easily spotted when data has been grouped
- Calculations are much quicker with data that has been grouped
- It is important to be aware, however, that grouped frequency tables also have some negatives
- The actual data values are lost when data is grouped
- It is only possible to calculate estimated averages, ranges and summary statistics
Notation for grouped frequency tables
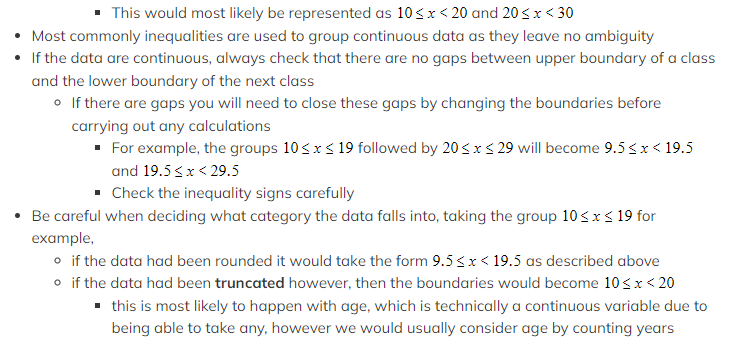
- When grouping data, it is important to be clear about which group or class any data value should be entered into
- A group entry of 10 – 20 followed by 20 – 30 would be unclear because the number 20 could be entered into both groups
- If the data are discrete, this could be written as 10 – 19 and 20 – 29
- For continuous data, this could be changed to 10 – and 20 –
- A group entry of 10 – 20 followed by 20 – 30 would be unclear because the number 20 could be entered into both groups
 Finding averages from grouped frequency tables
- Instead of finding the mode, when working with a grouped frequency table we instead find the modal class
- This will be the class (group) with the greatest frequency
- It is only possible to calculate an estimate for the mean and the median from a grouped frequency table
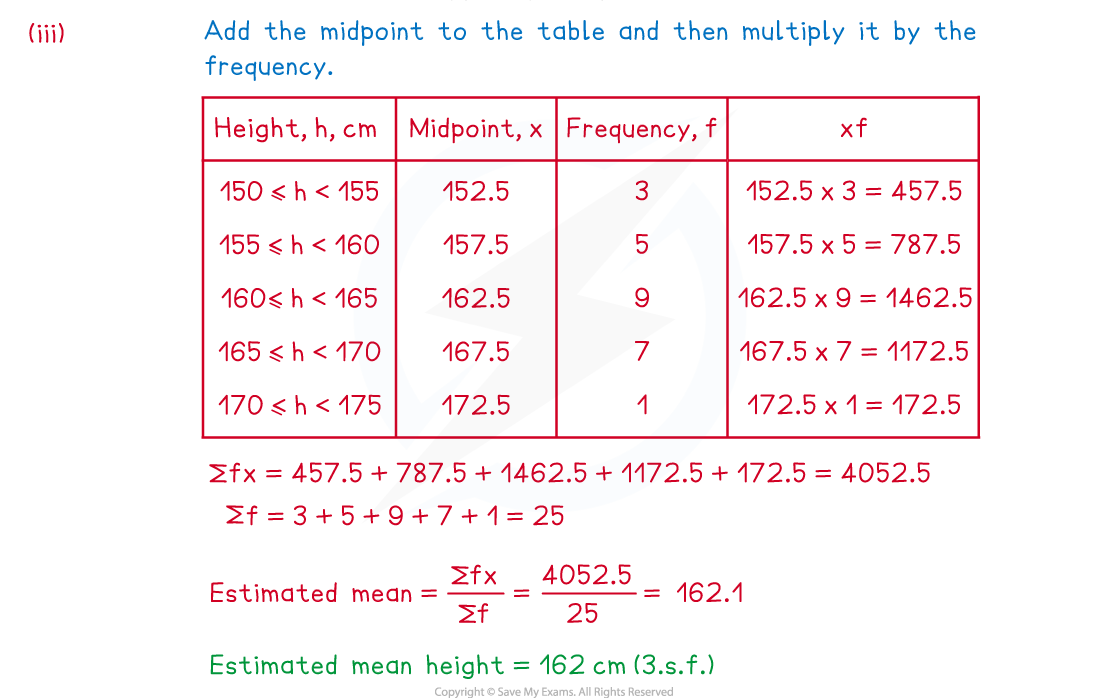
- Calculating the estimated mean is the same as for ungrouped frequency tables, however you will need to find the midpoints first
- the midpoint is the mean of the upper and lower values in the class boundaries
 Calculating the estimated median is more complicated and questions will only ask for the class that the estimated median would be in
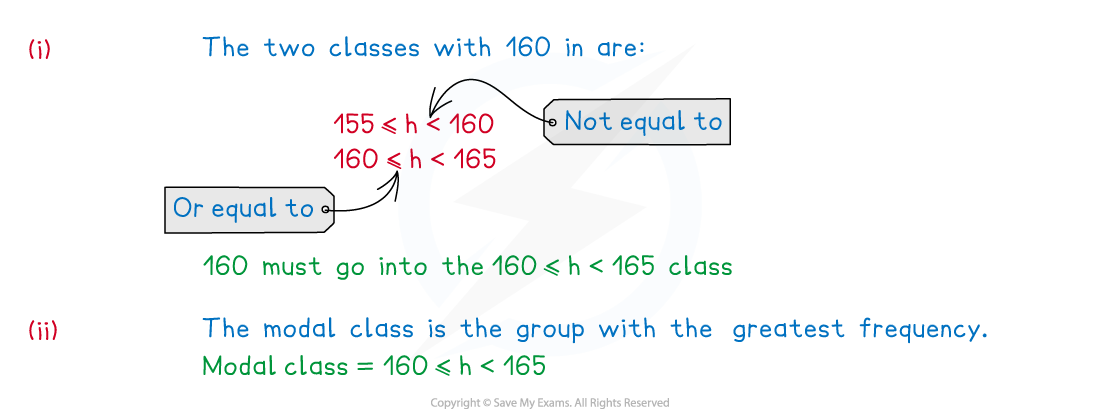
Worked Example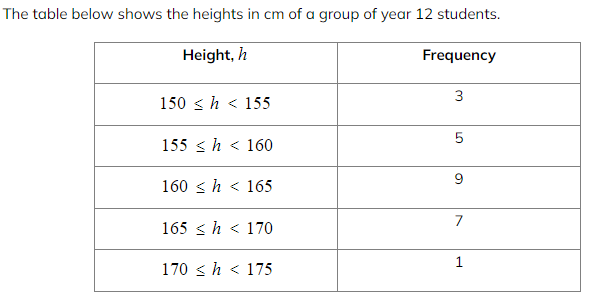 (i)Write down the class that a student of exactly 160 cm should be added to.
(ii)Write down the modal class.
(iii)Calculate the estimated mean height.
Exam Tip
- There can be a lot of calculations when working with grouped frequency tables, be extra careful when using your calculators as it is easy to make small errors with these questions. Use the table and add information to the table as you go as there will be marks available for showing work within the methods.
转载自savemyexams

最新发布
© 2025. All Rights Reserved. 沪ICP备2023009024号-1


