- 翰林提供学术活动、国际课程、科研项目一站式留学背景提升服务!
- 400 888 0080
CIE A Level Physics复习笔记17.1.1 Describing Oscillations
Describing Oscillations
- An oscillation is defined as:
Repeated back and forth movements on either side of any equilibrium position
- When the object stops oscillating, it returns to its equilibrium position
- An oscillation is a more specific term for a vibration
- An oscillator is a device that works on the principles of oscillations
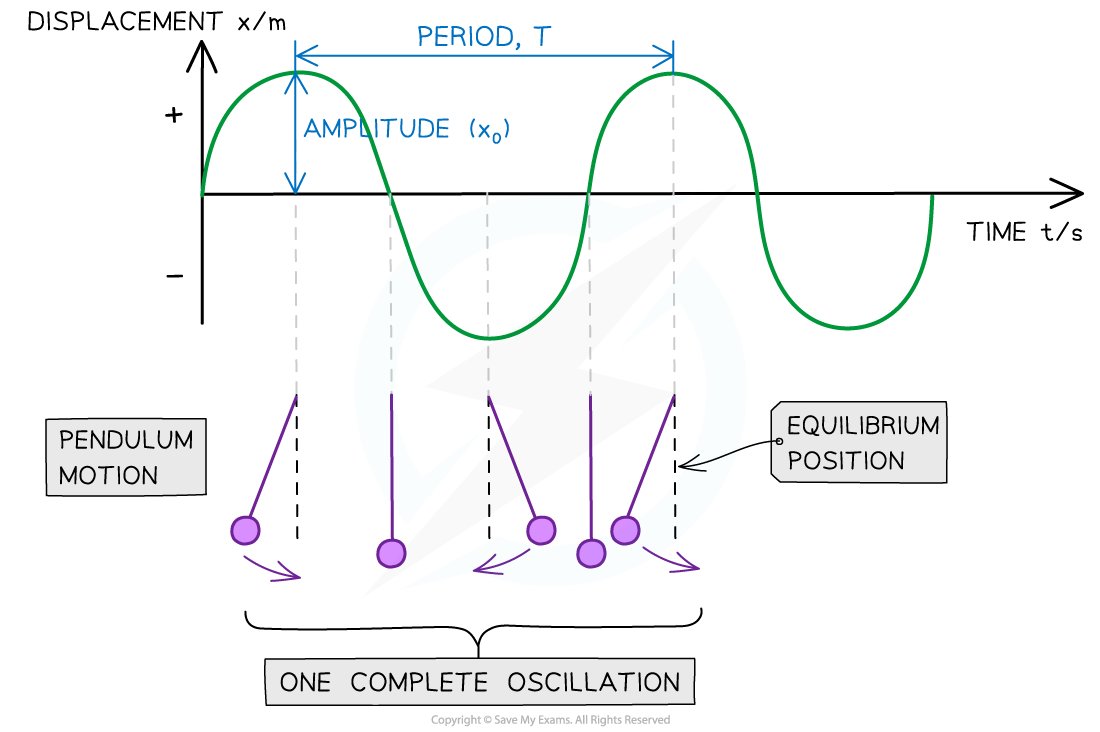
- Oscillating systems can be represented by displacement-time graphs similar to transverse waves
- The shape of the graph is a sine curve
- The motion is described as sinusoidal
Properties of Oscillations
- Displacement (x) of an oscillating system is defined as:
The distance of an oscillator from its equilibrium position
- Amplitude (x0) is defined as:
The maximum displacement of an oscillator from its equilibrium position
- Angular frequency (⍵) is defined as:
The rate of change of angular displacement with respect to time
- This is a scalar quantity measured in rad s-1 and is defined by the equation:

- Frequency (f) is defined as:
The number of complete oscillations per unit time
- It is measured in Hertz (Hz) and is defined by the equation:

- Time period (T) is defined as:
The time taken for one complete oscillation, in seconds
- One complete oscillation is defined as:
The time taken for the oscillator to pass the equilibrium from one side and back again fully from the other side
- The time period is defined by the equation:

- Phase difference is how much one oscillator is in front or behind another
- When the relative position of two oscillators are equal, they are in phase
- When one oscillator is exactly half a cycle behind another, they are said to be in anti-phase
- Phase difference is normally measured in radians or fractions of a cycle
- When two oscillators are in antiphase they have a phase difference of π radians

Displacement-time graph of an oscillation of a simple pendulum
Worked Example
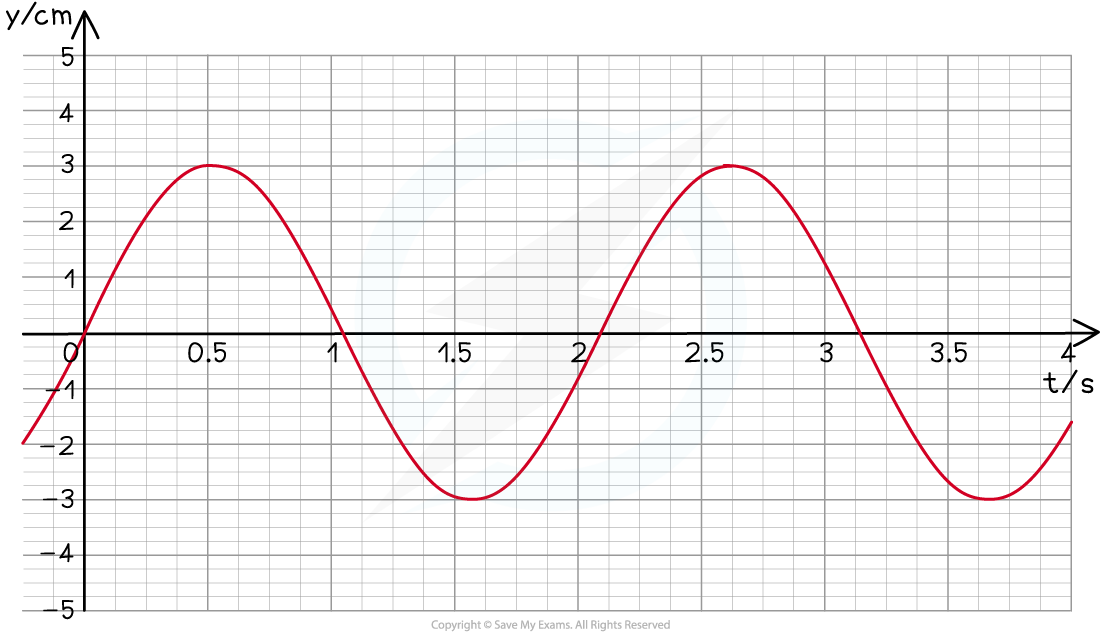
A student sets out to investigate the oscillation of a mass suspended from the free end of a spring. The mass is pulled downwards and then released. The variation with time t of the displacement y of the mass is shown in the figure below.
Use the information from the figure to calculate the angular frequency of the oscillations.
Step 1:
Write down the equation for angular frequency

Step 2:
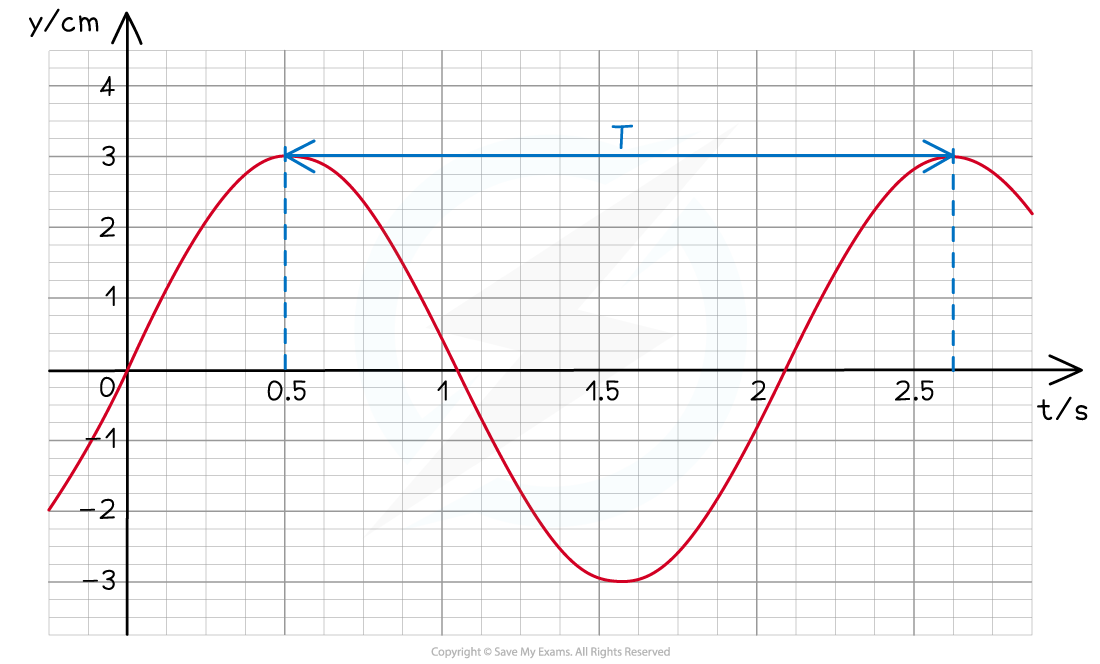
Calculate the time period T from the graph
The time period is defined as the time taken for one complete oscillation
This can be read from the graph:
 T = 2.6 − 0.5 = 2.1 s
Step 3:
Substitute into angular frequency equation

Exam Tip
The properties used to describe oscillations are very similar to transverse waves. The key difference is that oscillators do not have a ‘wavelength’ and their direction of travel is only kept within the oscillations themselves rather than travelling a distance in space.
转载自savemyexams

最新发布
© 2025. All Rights Reserved. 沪ICP备2023009024号-1


