- 翰林提供学术活动、国际课程、科研项目一站式留学背景提升服务!
- 400 888 0080
CIE A Level Chemistry复习笔记1.8.4 Homogeneous & Heterogeneous Catalysts
Catalysts
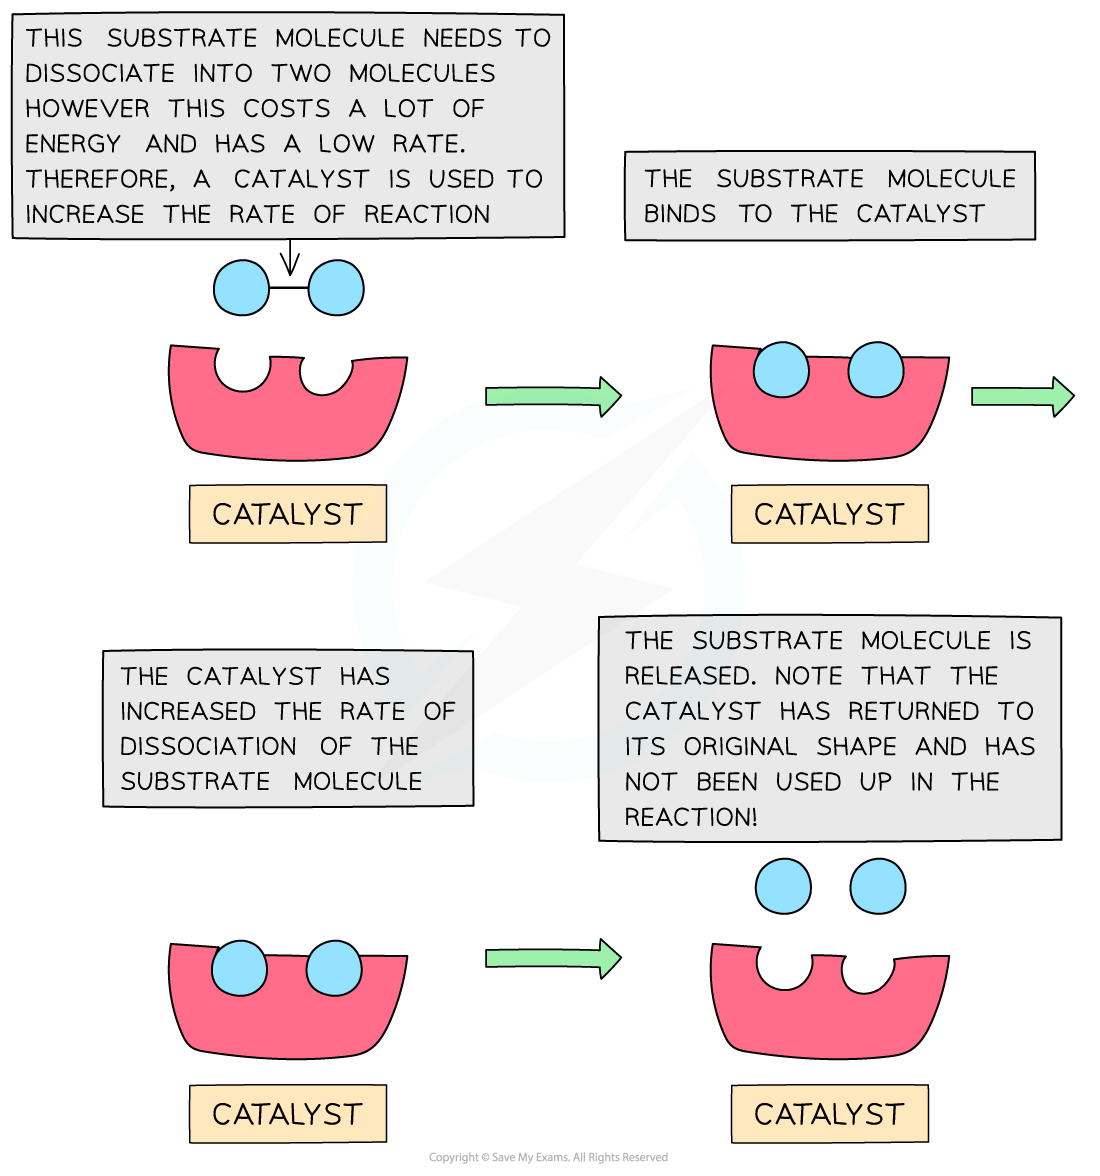
- Catalysis is the process in which the rate of a chemical reaction is increased, by adding a substance called a catalyst
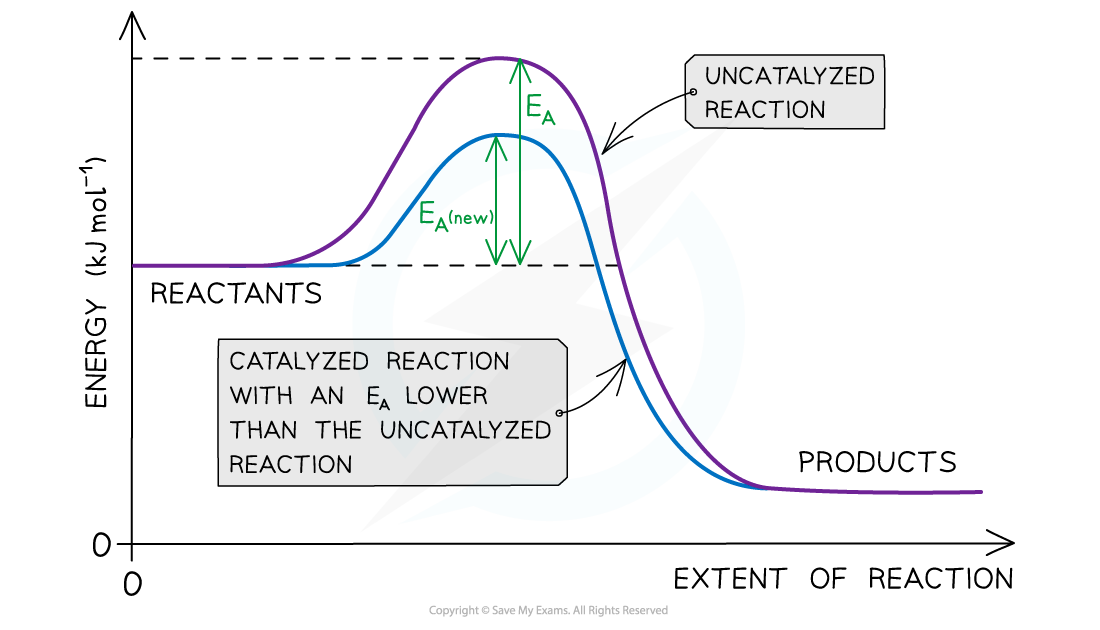
- A catalyst increases the rate of a reaction by providing the reactants with an alternative reaction pathway which is lower in activation energy than the uncatalysed reaction
- Catalysts can be divided into two types:
- Homogeneous catalysts
- Heterogeneous catalysts
- Homogeneous means that the catalyst is in the same phase as the reactants
- For example, the reactants and the catalysts are all liquids
- Heterogeneous means that the catalyst is in a different phase to the reactants
- For example, the reactants are gases but the catalyst used is a solid

The diagram shows that the catalyst speeds up a reaction that would normally be slow due to the high activation energy. The catalyst is not used up in the chemical reaction and is not taking part in the chemical reaction

The diagram shows that the catalyst allows the reaction to take place through a different mechanism, which has a lower activation energy than the original reaction
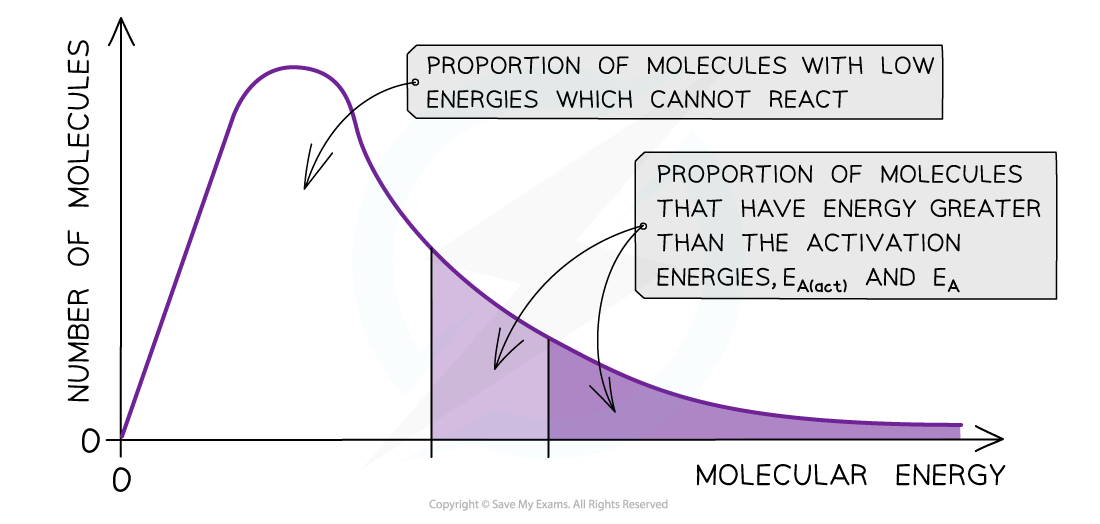
Boltzmann distribution curve
- Catalyst provide the reactants another pathway which has a lower activation energy
- By lowering Ea, a greater proportion of molecules in the reaction mixture have sufficient energy for an effective collision
- As a result of this, the rate of the catalysed reaction is increased compared to the uncatalyzed reaction
 The diagram shows that the total shaded area (both dark and light shading) under the curve shows the number of particles with energy greater than the Ea when a catalyst is present. This area is much larger than the dark shaded area which shows the number of particles with energy greater than the Ea without a catalyst
转载自savemyexams

最新发布
© 2026. All Rights Reserved. 沪ICP备2023009024号-1


