- 翰林提供学术活动、国际课程、科研项目一站式留学背景提升服务!
- 400 888 0080
CIE A Level Biology复习笔记18.2.6 Spearman's Rank Correlation
Spearman's Rank Correlation
- If there is an apparent relationship between two variables but the data does not show a normal distribution, Pearson’s linear correlation coefficient should not be used
- Spearman’s rank correlation determines whether there is correlation between variables that don’t show a normal distribution
- Method:
- Step 1: Create a scatter graph and identify possible linear correlation
- Step 2: State a null hypothesis
- Step 3: Use the following equation to work out Spearman’s rank correlation coefficient r

-
-
- Where:
- rs = spearman’s rank coefficient
- D = difference in rank
- n = number of samples
- Where:
- Step 4: Refer to a table that relates critical values of rs to levels of probability
-
- If the value calculated for Spearman’s rank is greater than the critical value for the number of samples in the data ( n ) at the 0.05 probability level (p), then the null hypothesis can be rejected, meaning there is a correlation between two variables
Worked Example
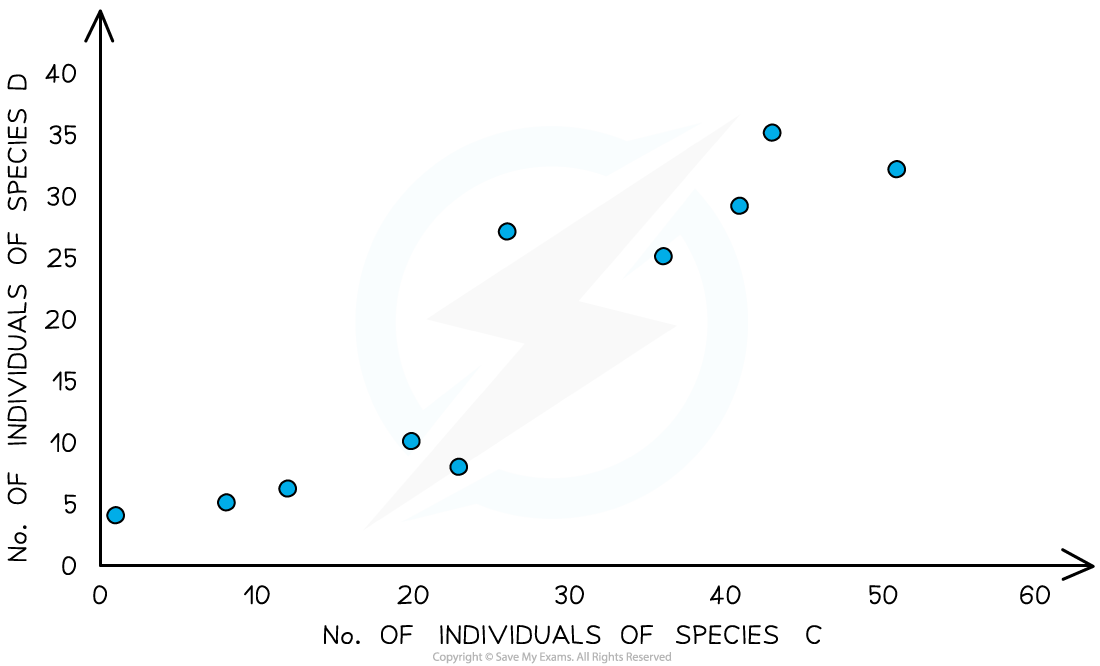
A student conducted an experiment using quadrats to measure the abundance of different plant species in a neglected allotment. They wanted to see if there was correlation between the abundance of species C and D. When they looked at their data and plotted a scatter graph they saw some correlation.Investigate the possible correlation using Spearman’s rank correlation coefficient.

Scatter graph showing the correlation between the abundance of species C and species D
As the data was not normally distributed they decided to use Spearman’s rank correlation coefficient.
Null hypothesis: there is no correlation between the abundance of species A and species B.
-
- n = 10 as there are 10 quadrat samples

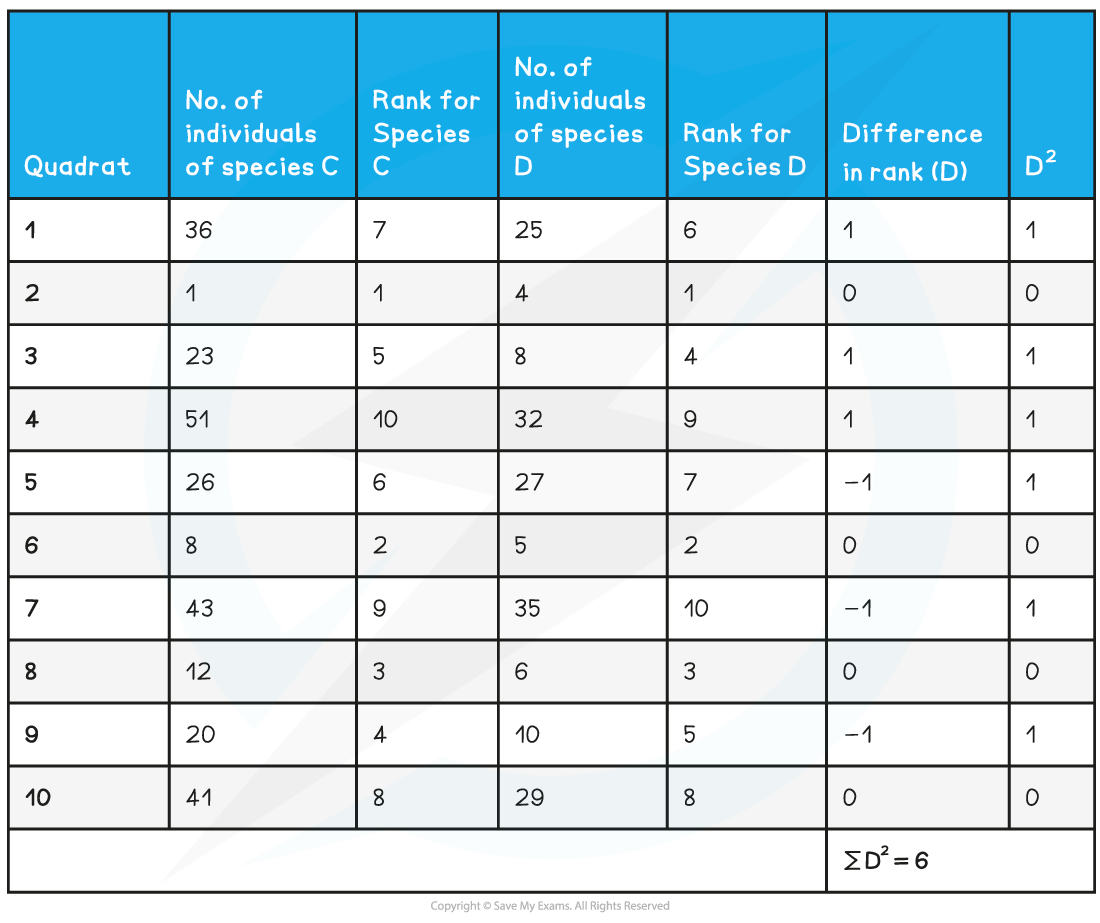
Step 1: Rank each set of data (rank 1 being the smallest data figure)
Step 2: Find the difference in rank between the two species, D
Step 3: Square the difference in rank, D2 (= 6)
Step 4: Substitute the appropriate numbers into the equation (remember n = 10)
Step 5: Refer to a table that relates values of rs to probability. Look for the 0.05 probability level with n = 10

-
- As Rs = 0.964, it is greater than the critical value of 0.65. The null hypothesis can be rejected, there is genuine positive correlation between the abundance of species A and B
Exam Tip
You will be provided with the formula for Spearman’s rank correlation in the exam. You need to be able to carry out the calculation to test for correlation, as you could be asked to do this in the exam. You should understand when it is appropriate to use the different statistical tests that crop up in this topic, and the conditions in which each is valid.Correlation does not always mean causation. Just because there is a correlation between the abundance of species A and species B it does not mean that the presence of species A causes the presence of species B.
转载自savemyexams

最新发布
© 2026. All Rights Reserved. 沪ICP备2023009024号-1


