- 翰林提供学术活动、国际课程、科研项目一站式留学背景提升服务!
- 400 888 0080
CIE A Level Biology复习笔记17.1.3 Variation: t-test Method
Variation: t-test Method
- A statistical test called the t-test can be used to compare the means of two sets of data and determine whether they are significantly different or not
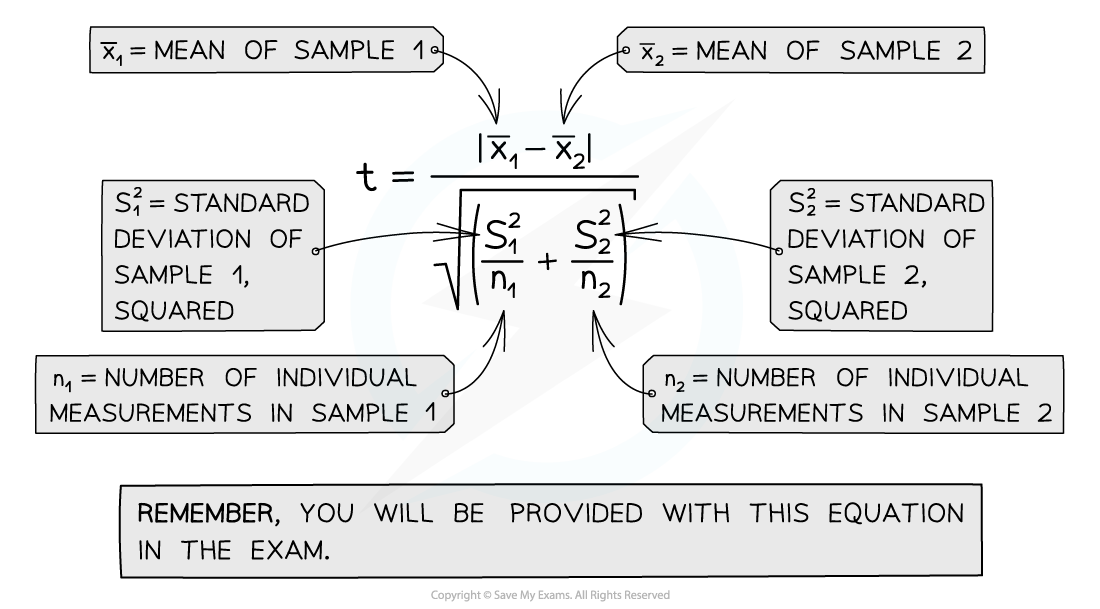
- The formula for the t-test will be provided in the exam, but formulae for how to calculate the number of degrees of freedom is not provided in the exam and must be learnt
- The sets of data must follow a rough normal distribution, be continuous and the standard deviations should be approximately equal
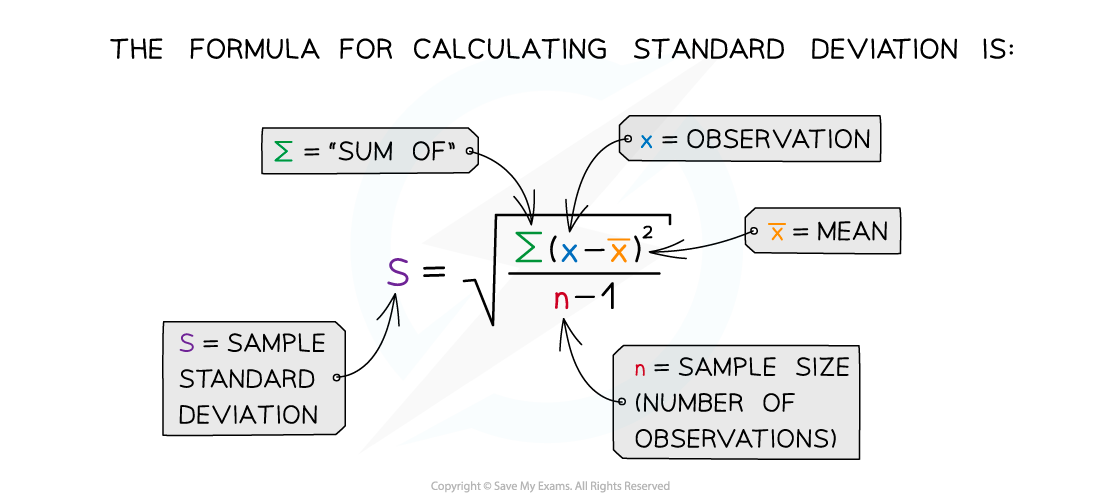
- The standard deviation (s) must be calculated for each data set before the t-test can be carried out
- A null hypothesis should also be given
- This is a statement of what we would expect if there is no significant difference between two means, and that any differences seen are due to chance
- If there is a statistically significant difference between the means of two sets of data, then the observation is not down to chance and the null hypothesis can be rejected
Calculating the standard deviation

Using the t-test to compare two means
- The steps below outline the general steps in a t test; for a worked example see the next page
- Null hypothesis: there is no statistically significant difference between the means of sample 1 and sample 2
- Step 1: Calculate the mean for each data set:
![]()
- Step 2: Calculate the standard deviation for each set of data, s1 = standard deviation of sample 1 and s2 = standard deviation of sample 2

- Step 3: Square the standard deviation and divide by n (the number of observations) in each sample, for both samples:

- Step 4: Add the values from step 3 together and take the square root:

- Step 5: Divide the difference between the two means (see step 1) with the value calculated in step 4 to get the t value:

- Step 6: Calculate the degrees of freedom (v) for the whole data set (remember the formulae for this will not be given in the exam):v = (n1 - 1) + (n2 - 1)
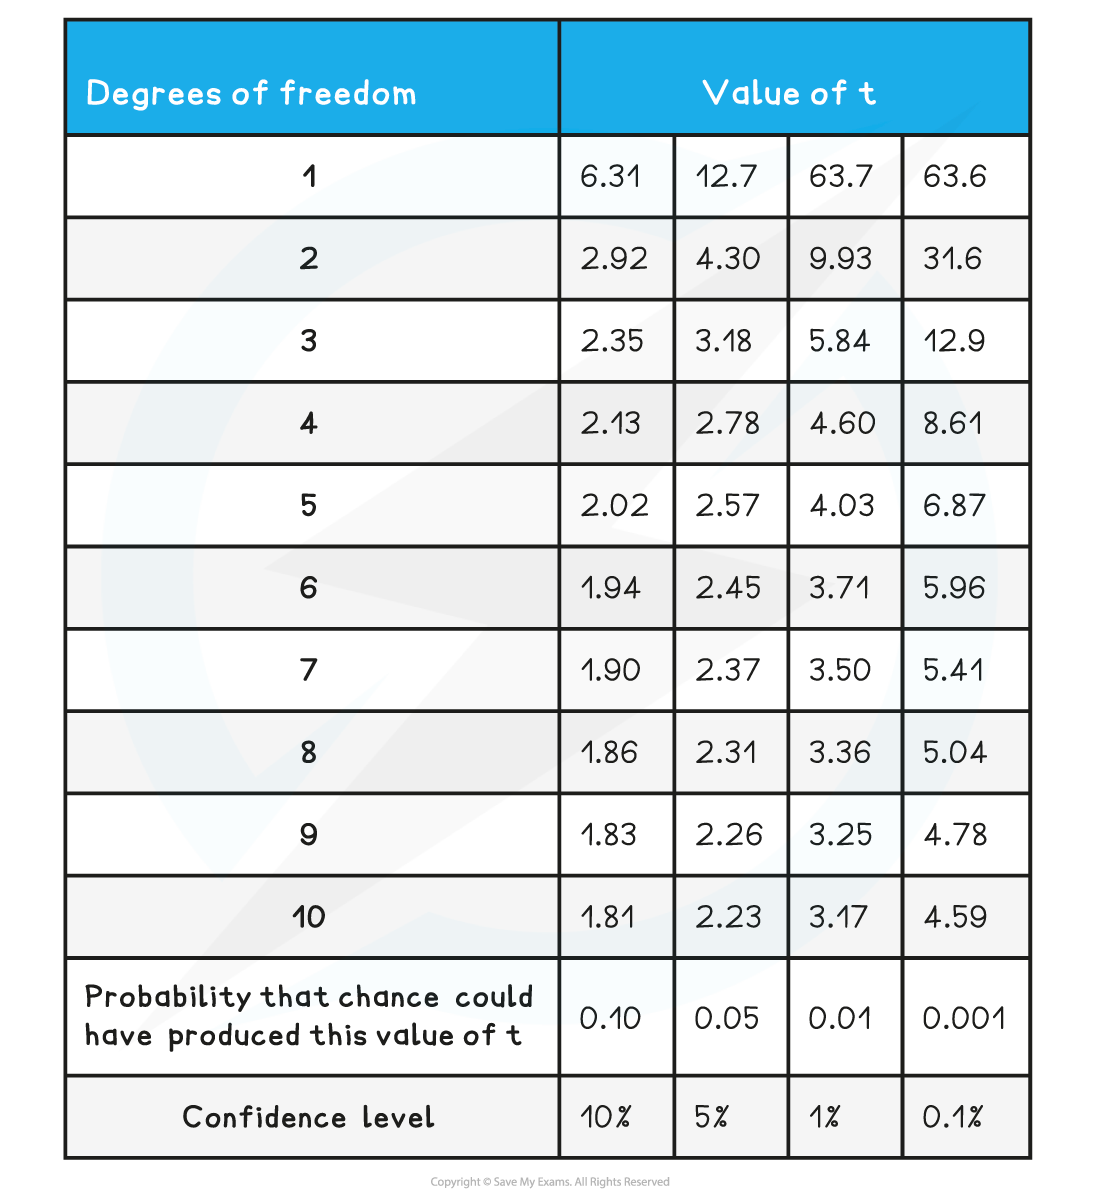
- Step 7: Look at a table that relates t values to the probability that the differences between data sets is due to chance to find where the t value for the degrees of freedom (v) calculated lies
T values table

- Step 8: The greater the t value calculated (for any degree of freedom), the lower the probability of chance causing any significant difference between the two sample means
- Identify where the t value calculated lies with respect to the confidence levels provided
- If the t value is greater than the critical value (obtained from the table at the critical probability of 0.05) then any difference between the two data sets is less likely to be due to chance, so the null hypothesis can be rejected
- If the t value is less than the critical value given at a confidence of 5% / the probability that any difference is down to chance is above 0.05; then an assumption can be made that the differences between the means of the two sets of data are not significant and the null hypothesis is accepted
- Using the table above, if a value of t was calculated to be 2.38 at 5 degrees of freedom, then it lies between 2.02 and 2.57, so the probability that chance produced any differences between the two means is between 10% and 5%; the null hypothesis would be accepted in this situation
Exam Tip
If you need to calculate the t value you will be given the formula in the exam. Generally questions on the t-test require you to:
- Know why a t-test is being used to analyse the data
- State the null hypothesis
- Know how the degrees of freedom was calculated
- State the conclusion (are the differences between the two means significant or not)
转载自savemyexams

在线登记
最新发布
© 2025. All Rights Reserved. 沪ICP备2023009024号-1


