- 翰林提供学术活动、国际课程、科研项目一站式留学背景提升服务!
- 400 888 0080
CIE A Level Biology复习笔记3.2.6 Vmax & the Michaelis-Menten Constant
Vmax & the Michaelis-Menten Constant
- Substrate concentration affects the rate of catalysis in an enzyme-substrate reaction
- When the substrate concentration is fixed (and enzyme concentration is kept constant) the initial rate of reaction is fastest and as active sites become engaged, the reaction rate falls
- The Michaelis-Menten model describes the kinetics of such enzyme catalysed reactions
- In this model, two values are used to describe an enzyme catalysed reaction, the maximal rate or maximal velocity (Vmax) and the Michaelis-Menten constant (Km)
- These values are derived from the reaction rate at different substrate concentrations
- The maximum rate of reaction (Vmax) is used to derive the Michaelis–Menten constant (Km), which is used to compare the affinity of different enzymes for their substrates
Michaelis-Menten enzyme kinetics
- The Michaelis-Menten model is used to investigate the kinetics of enzyme catalysed reactions (enzyme kinetics is an area in biochemistry that studies how different variables affect reaction rates)
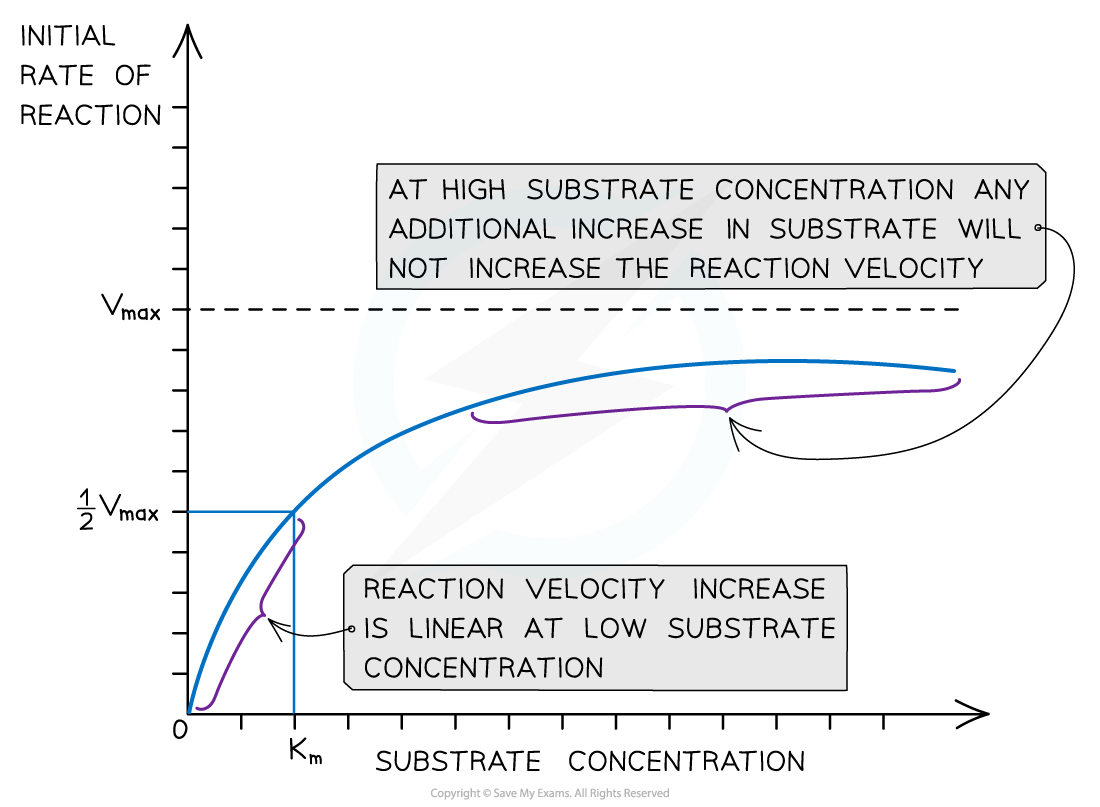
- The rate of reaction is measured at different substrate concentrations, producing a graph like the one below
- The two important values deduced are the Vmax (maximum rate of reaction at saturating substrate concentrations) and the Km, which is the substrate concentration at ½Vmax (also known as the Michaelis-Menten constant)
- The Michaelis-Menten constant is the substrate concentration at which the enzyme works at half its maximum rate
- At this point, half of the active sites of the enzyme are occupied by substrate molecules
- The higher the affinity of the enzyme for the substrate, the lower the substrate concentration needed for this to occur
- This is why the Michaelis-Menten constant is a measure of the affinity of an enzyme for its substrate
- There is an inverse relationship between the Km and the affinity of an enzyme for its substrate
- An enzyme with a high Km has a low affinity for its substrate and an enzyme with a low Km has a high affinity for its substrate

A graph showing the effect of substrate concentration on initial reaction rate, with Vmax, ½Vmax and Km values shown
Exam Tip
Make sure you can identify the Vmax and the Km on a graph!
转载自savemyexams

早鸟钜惠!翰林2025暑期班课上线

最新发布
© 2025. All Rights Reserved. 沪ICP备2023009024号-1


