- 翰林提供学术活动、国际课程、科研项目一站式留学背景提升服务!
- 400 888 0080
AQA A Level Maths: Statistics复习笔记3.2.2 Further Venn Diagrams
Further Venn Diagrams
What do you mean by further Venn diagrams?
- The Venn diagrams used here are no more complicated than those in the first Venn Diagrams revision note, however
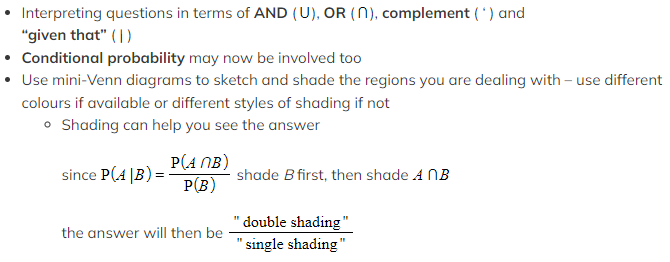
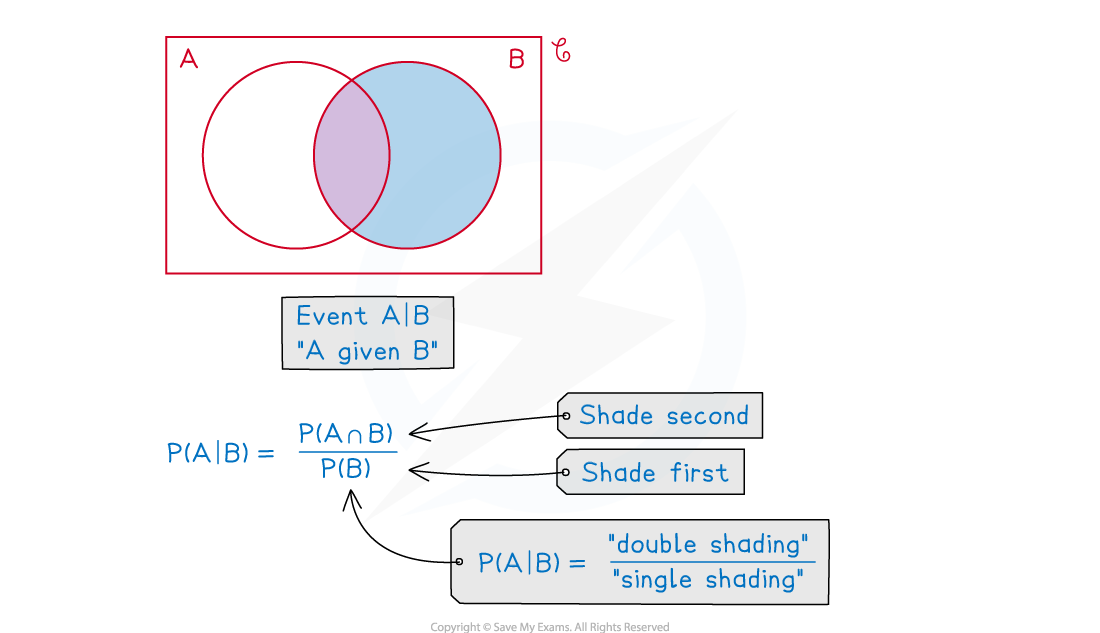
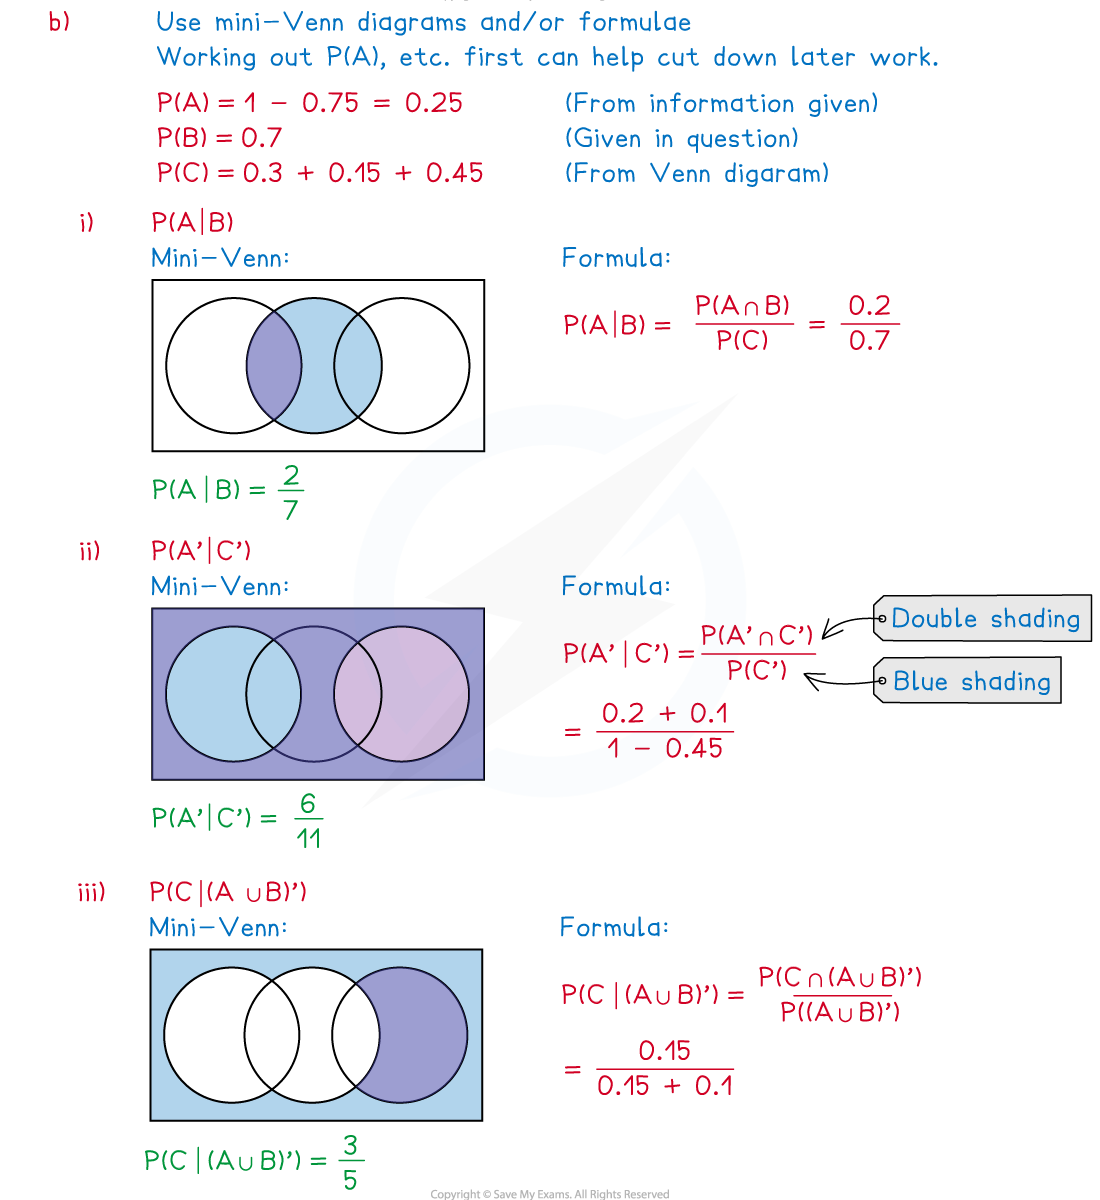
 Conditional probability problems can be solved using Venn diagrams
How do I solve conditional probability problems using Venn diagrams?
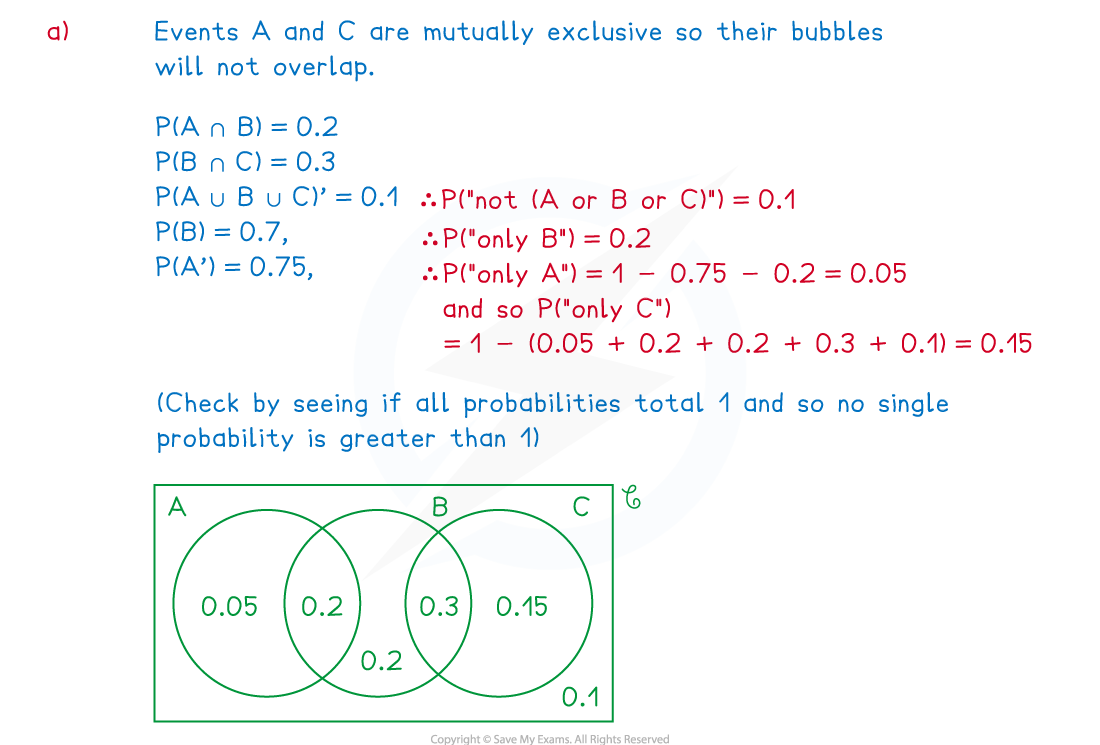
Worked Example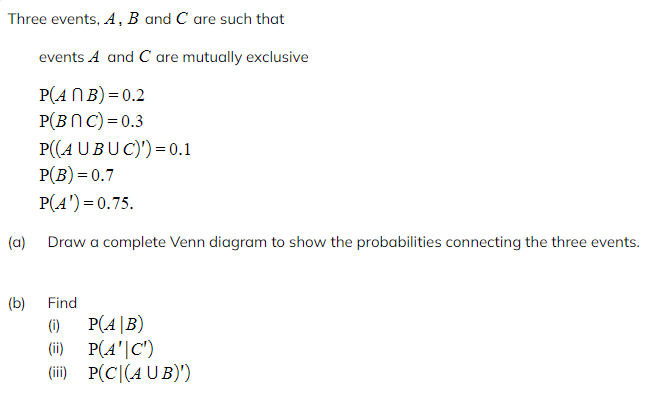
Exam Tip
- Always draw the box in a Venn diagram; it represents all possible outcomes of the experiment so is a crucial part of the diagram, the bubbles merely represent the events we are particularly interested in
- You may be able to answer some questions by applying formulae or you may prefer to use shaded mini-Venn diagrams; complicated questions tend to be easier with mini-Venn diagrams
转载自savemyexams

在线登记
最新发布
© 2025. All Rights Reserved. 沪ICP备2023009024号-1


