- 翰林提供学术活动、国际课程、科研项目一站式留学背景提升服务!
- 400 888 0080
IB DP Physics: SL复习笔记4.1.3 SHM Graphs
SHM Graphs
Displacement & Velocity
- The displacement-time graph for an object moving with SHM is a sinusoidal curve if:
- The object starts to oscillate from the equilibrium position.
- The equilibrium position is x = 0 at t = 0
- The displacement-time graph is a cosine curve if
- The object starts to oscillate from the position of maximum displacement.
- Maximum displacement is x = x0 at t = 0
- The maxima and minima on the graph are the values of maximum displacement (x0) of the oscillating object on either side of the equilibrium position
- The velocity-time graph is obtained by taking the gradients of tangents to all points on the displacement-time graph
- The velocity-time graph is a cosine curve if:
- The object starts to oscillate from the equilibrium position when x = 0 at t = 0
- The displacement-time graph is a sine curve
- The velocity-time graph is a sine curve if:
- The object starts to oscillate from the position of maximum displacement when x = x0 at t = 0
- The velocity-time graph is a cosine curve
- The maxima and minima on the graph are the values of maximum velocity (v0) of the oscillating object as it passes the equilibrium position
- The difference in the sign of the velocity accounts for the different directions of the velocity vector as the object passes through the equilibrium position (i.e. from right to left or vice versa)
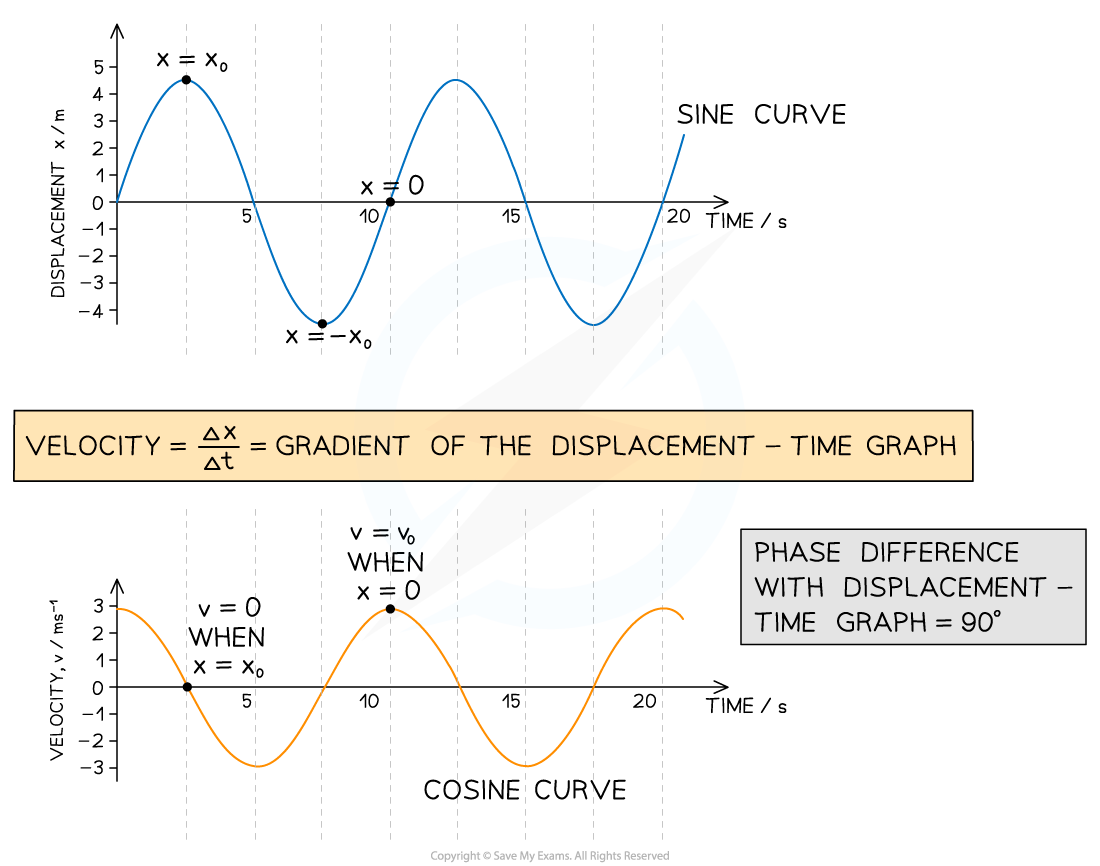
Displacement-time & velocity-time graphs for an object oscillating with SHM. The object starts oscillating from the equilibrium position (x = 0 and t = 0)
Acceleration
- The acceleration-time graph is obtained by taking the gradients of tangents to all points on the velocity-time graph
- The graph is a negative sine curve if:
- The object starts to oscillate from the equilibrium position when x = 0 at t = 0
- The graph is a negative cosine curve if:
- The object starts to oscillate from the position of maximum displacement when x = x0 at t = 0
- The maxima and minima on the graph are the values of maximum acceleration (a0) of the oscillating object at the positions of maximum displacement (x = x0)
- Once again, the difference in sign indicates a difference in the direction of the acceleration vector
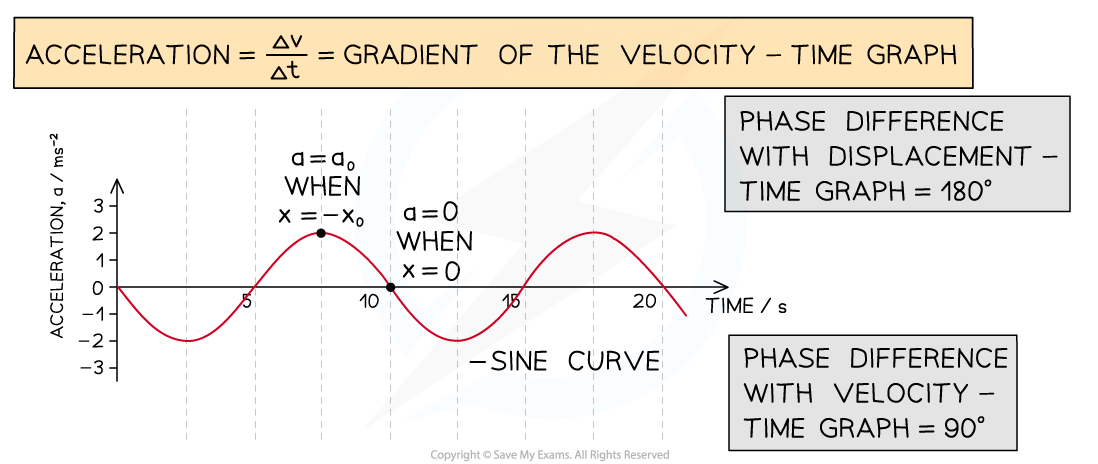
An acceleration-time graph for an object oscillating with SHM. The object starts oscillating from the equilibrium position (x = 0 and t = 0)
- Note that all graphs must have the same period
- The only two differences between the graphs are:
- The shift in time - i.e. there is a phase difference of 90° between successive graphs
- The amplitude of the wave form - i.e. the different amplitudes of the three graphs are the values of maximum displacement x0, maximum velocity v0 and maximum acceleration a0 of the oscillating object
Worked Example
Below is the displacement-time graph for an object oscillating with SHM.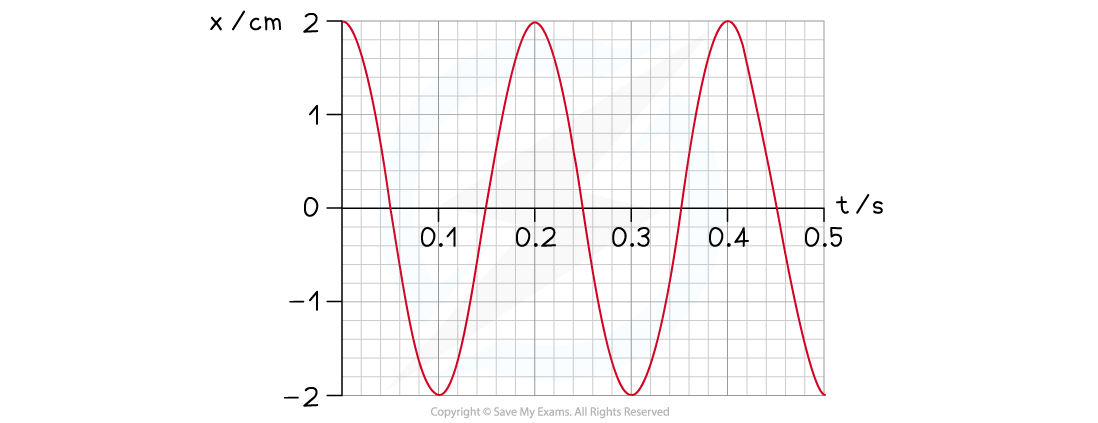
(i) Determine the period of the oscillations
(ii) Calculate the frequency of the oscillations
(iii) Mark a point on the graph where the velocity is zero, label this with "v = 0"
(iv) Mark a point on the graph where the velocity is maximum and positive, label this with "v0"
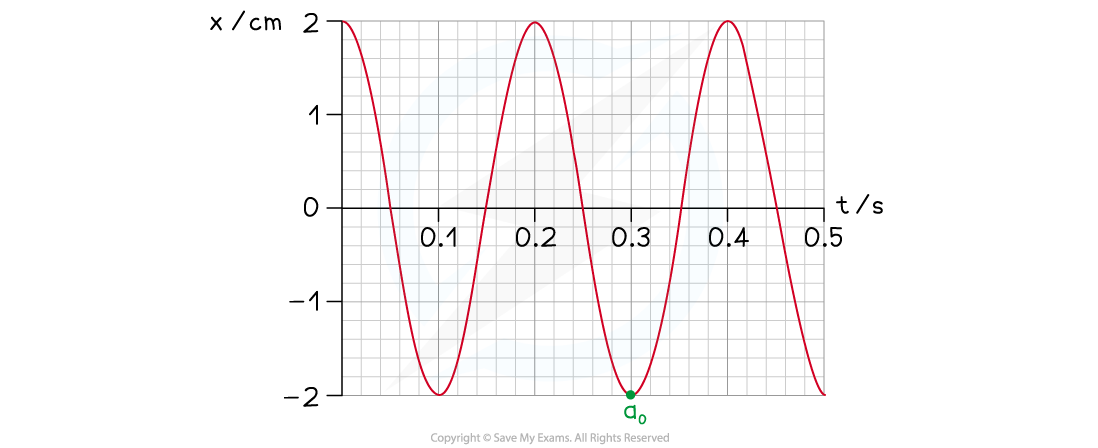
(v) Mark a point on the graph where the acceleration is maximum and positive, label this with "a0"
(vi) Determine the value of the maximum velocity v0
(i) Identify the period T of the oscillating object on the graph
-
- Mark the time between any two identical points on the graph (e.g. two peaks)
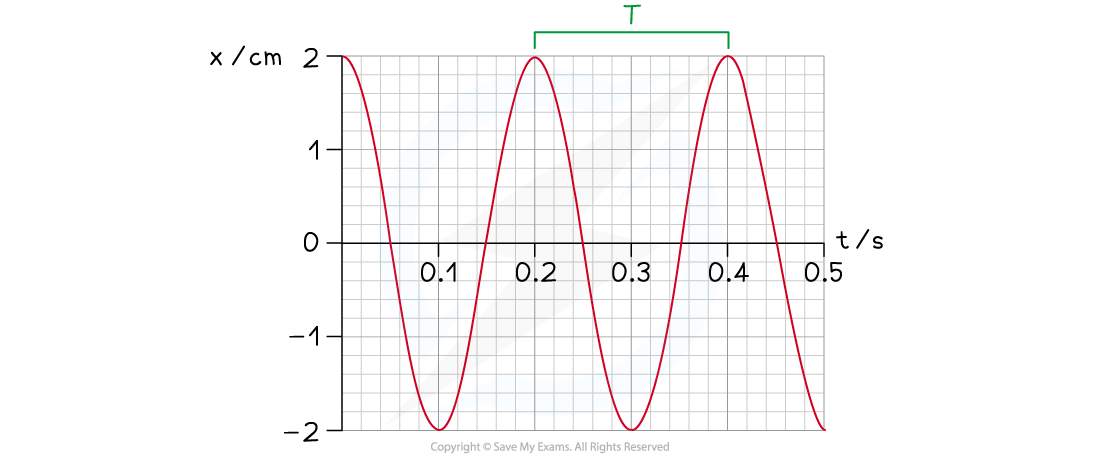
T = 0.20 s
(ii) Calculate the frequency f
Step 1: Write down the relationship between frequency and period
![]()
Step 2: Substitute the value of the period you have determined in part (i)
![]()
f = 5 Hz
(iii) Identify any position of zero velocity on the displacement-time graph and label this "v = 0"
-
- The velocity of an object oscillating with SHM is zero at the positions of maximum displacement x = x0
- Hence, the velocity is zero at any minima or maxima on the displacement-time graph (e.g. at t = 0.10 s)
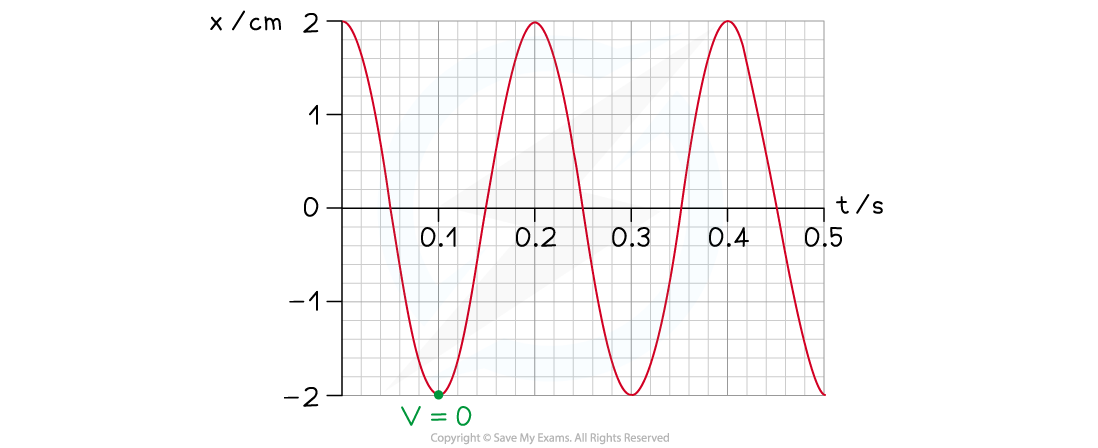 (iv) Identify any position of maximum positive velocity on the displacement-time graph and label this "v0"
-
- An object oscillating with SHM has its maximum velocity at the equilibrium position (x = 0)
- Velocity is defined as the rate of change of displacement
- The velocity is the gradient of the tangent to a point of zero displacement
- The gradient must be positive (e.g. at t = 0.15 s)
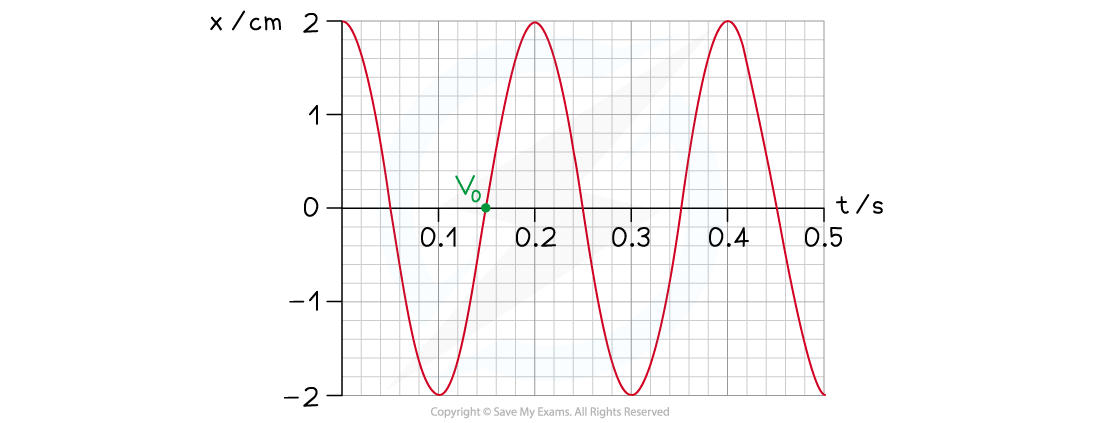
(v) Identify any position of maximum positive acceleration on the displacement-time graph and label this "a0"
-
- An object oscillating with SHM has its maximum acceleration at the positions of maximum displacement (x = x0)
- Acceleration is proportional to negative displacement
- The acceleration is maximum and positive when the displacement is maximum and negative
- The acceleration is maximum and positive at any minima on the displacement-time graph (e.g. at t = 0.30 s)
 (vi)
(vi)
Step 1: Draw the tangent to the point of maximum positive velocity identified in Step 4 (i.e. at t = 0.15 s)
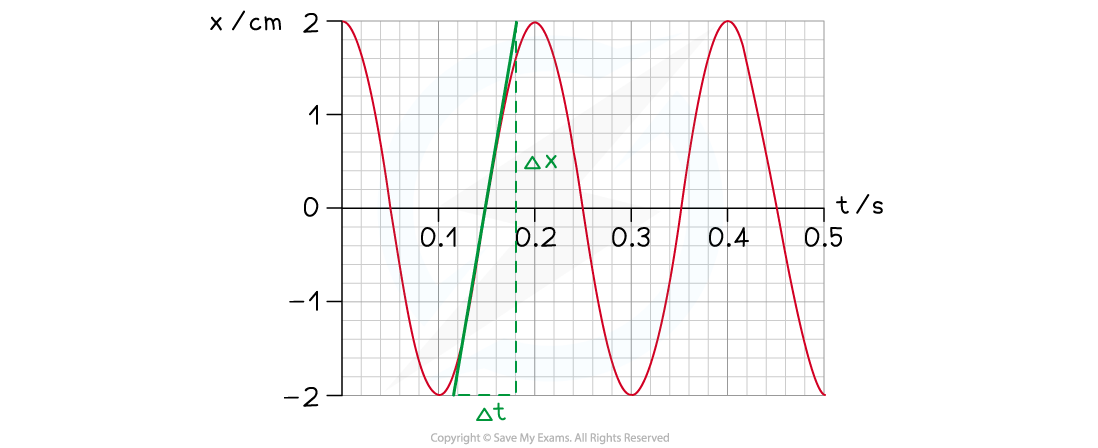
Step 2: Calculate the gradient of the tangent to get the value of the maximum velocity v0 in centimetres per second (cm s–1)
![]()
![]()
Gradient = 67 cm s–1
v0 = 67 cm s–1
转载自savemyexams

早鸟钜惠!翰林2025暑期班课上线

最新发布
© 2025. All Rights Reserved. 沪ICP备2023009024号-1


