- 翰林提供学术活动、国际课程、科研项目一站式留学背景提升服务!
- 400 888 0080
IB DP Physics: HL复习笔记1.2.3 Determining Uncertainties from Graphs
Error Bars
- The uncertainty in a measurement can be shown on a graph as an error bar
- This bar is drawn above and below the point (or from side to side) and shows the uncertainty in that measurement
- Error bars are plotted on graphs to show the absolute uncertainty of values plotted
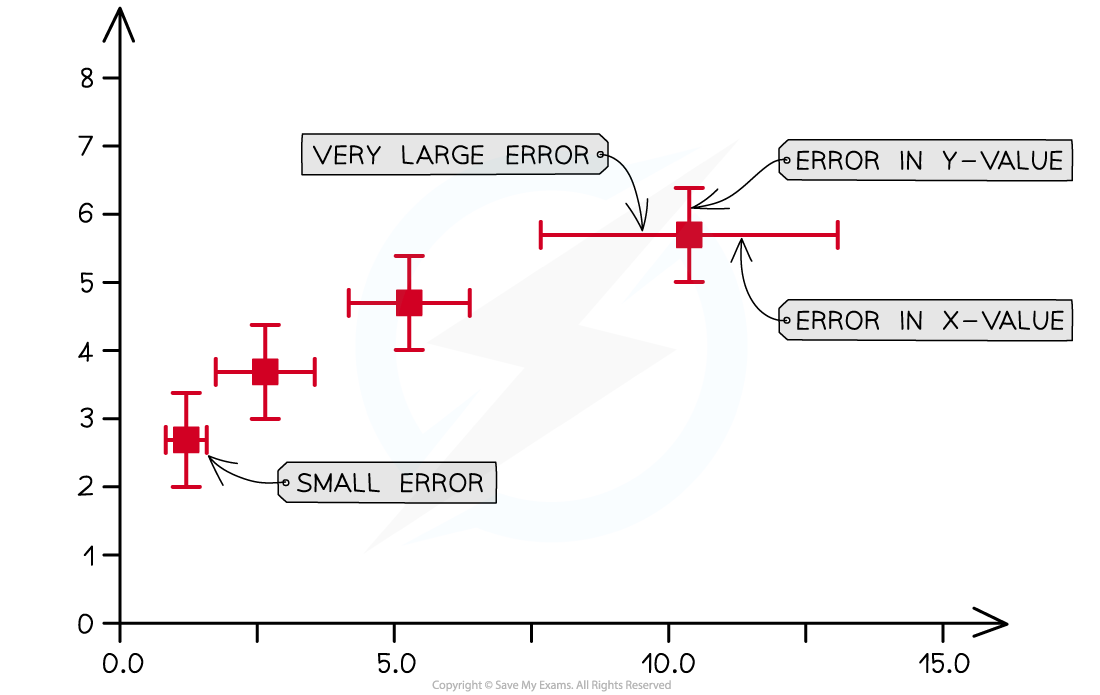
Representing error bars on a graph
Exam Tip
A common misconception is that error bars need to all be the same size. In physics, this is not the case and each data point can have different error bar sizes as they have different uncertainties.
Determining Uncertainties from Graphs
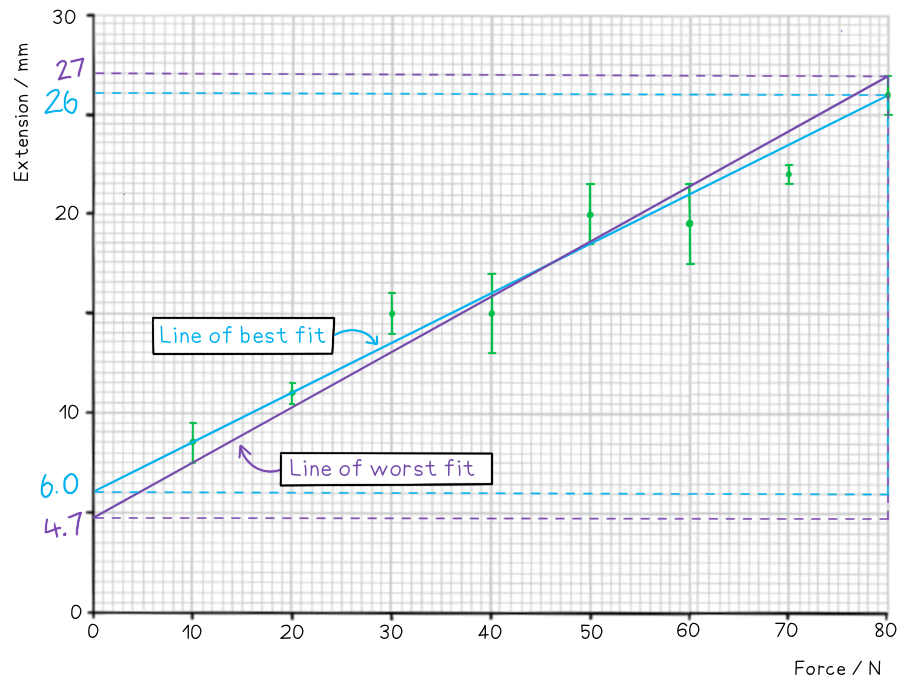
- To calculate the uncertainty in a gradient, two lines of best fit should be drawn on the graph:
- The ‘best’ line of best fit, which passes as close to the points as possible
- The ‘worst’ line of best fit, either the steepest possible or the shallowest possible line which fits within all the error bars
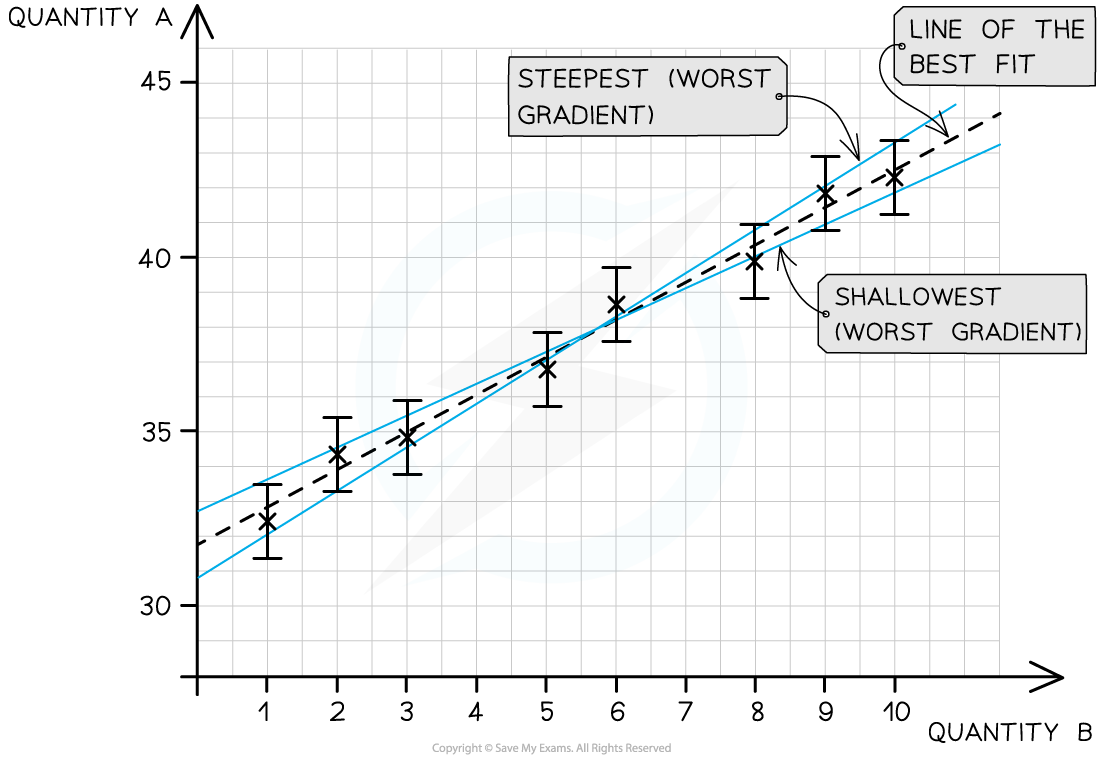
The line of best fit passes as close as possible to all the points. The steepest and shallowest lines are known as the worst fit
- The percentage uncertainty in the gradient can be found using the magnitude of the 'best' and 'worst' gradients:
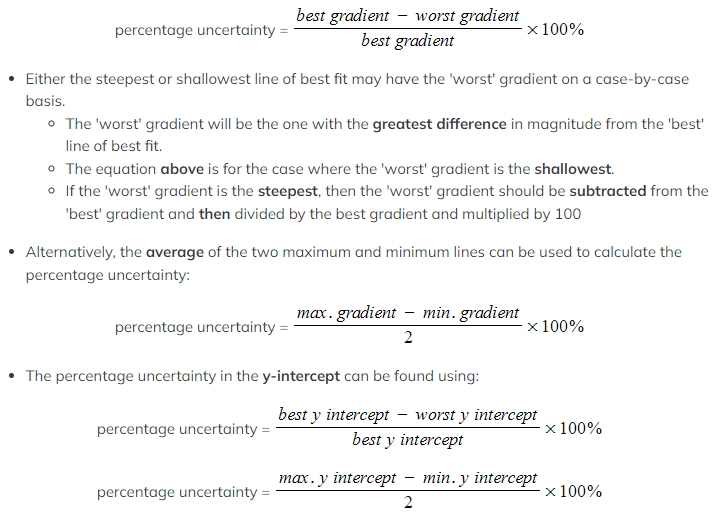 Percentage Difference
- The percentage difference gives an indication of how close the experimental value achieved from an experiment is to the accepted value
- It is not a percentage uncertainty
- The percentage difference is defined by the equation:

- The experimental value is sometimes referred to as the 'measured' value
-
- This may be labelled on a component such as the capacitance of a capacitor or the resistance of a resistor
- Or, from a reputable source such as a peer-reviewed data bookletThe accepted value is sometimes referred to as the 'true' value
- For example, the acceleration due to gravity g is known to be 9.81 m s–2. This is its accepted value
- From an experiment, the value of g may be found to be 10.35 m s–2
- Its percentage difference would therefore be 5.5 %
- The smaller the percentage difference, the more accurate the results of the experiment
Worked Example
On the axes provided, plot the graph for the following data and draw error bars and lines of best and worst fit. Find the percentage uncertainty in the gradient from your graph.
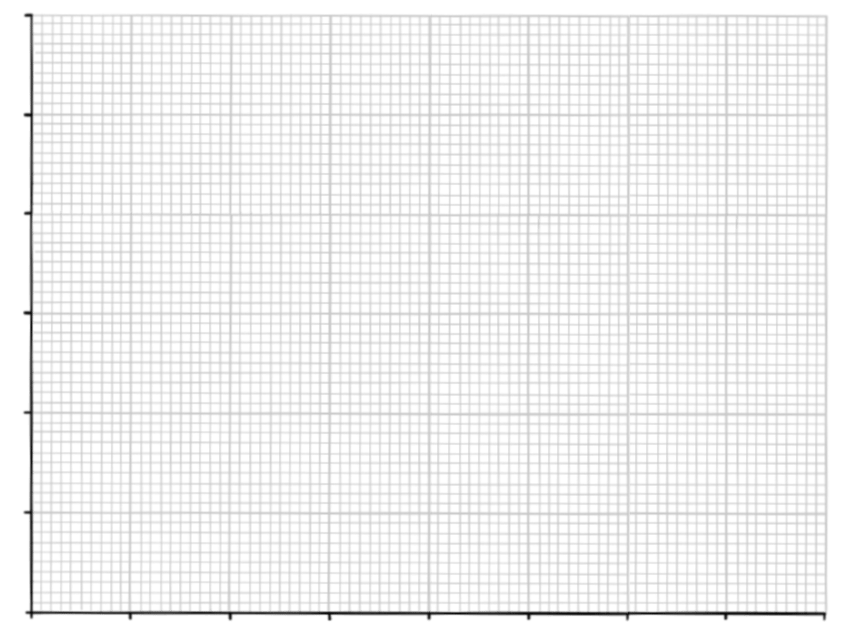
Step 1: Draw sensible scales on the axes and plot the data
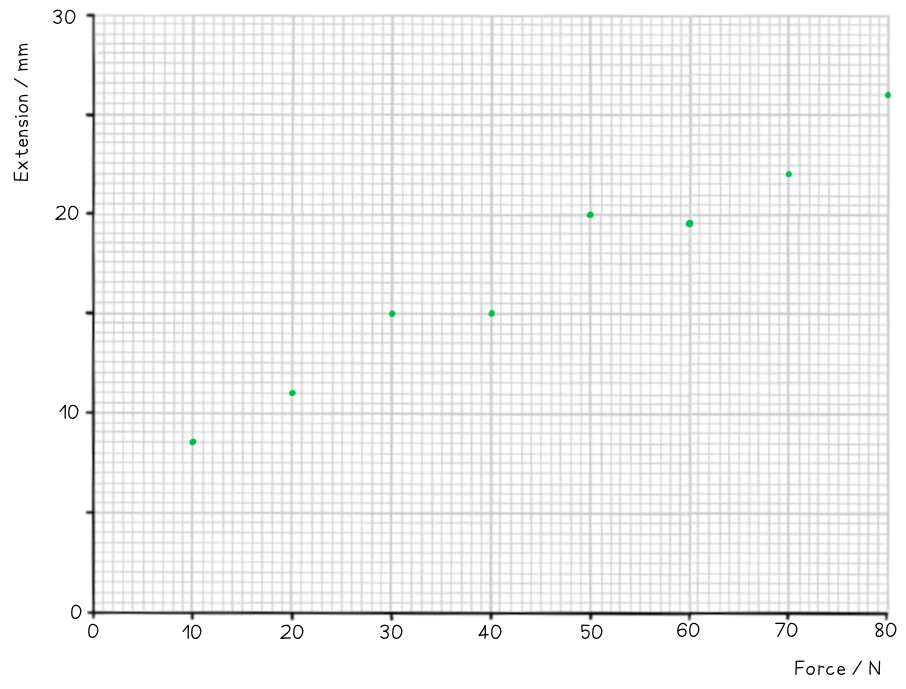
Step 2: Draw the errors bars for each point
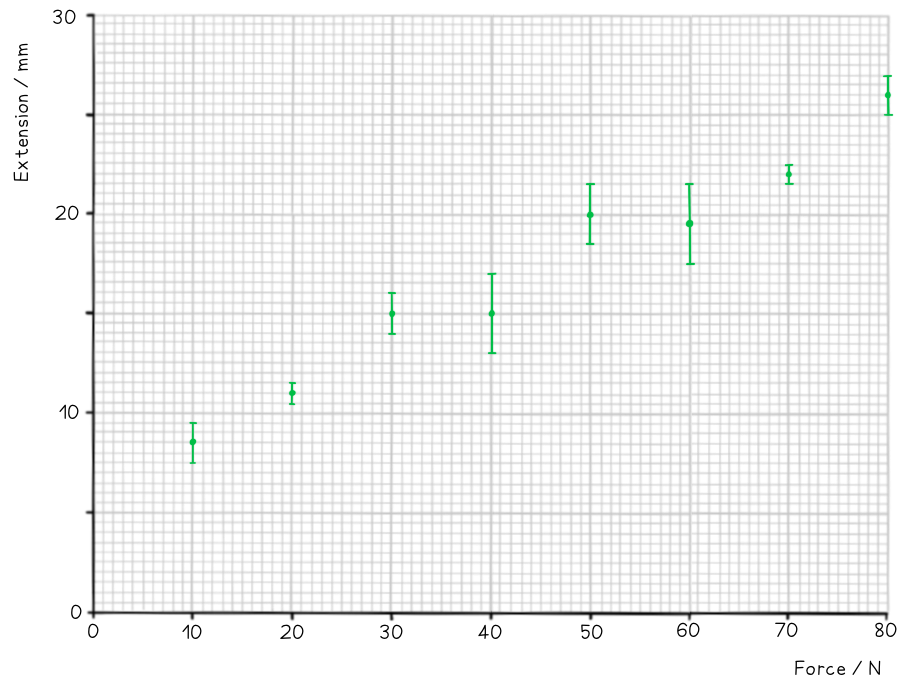
Step 3: Draw the line of best fit
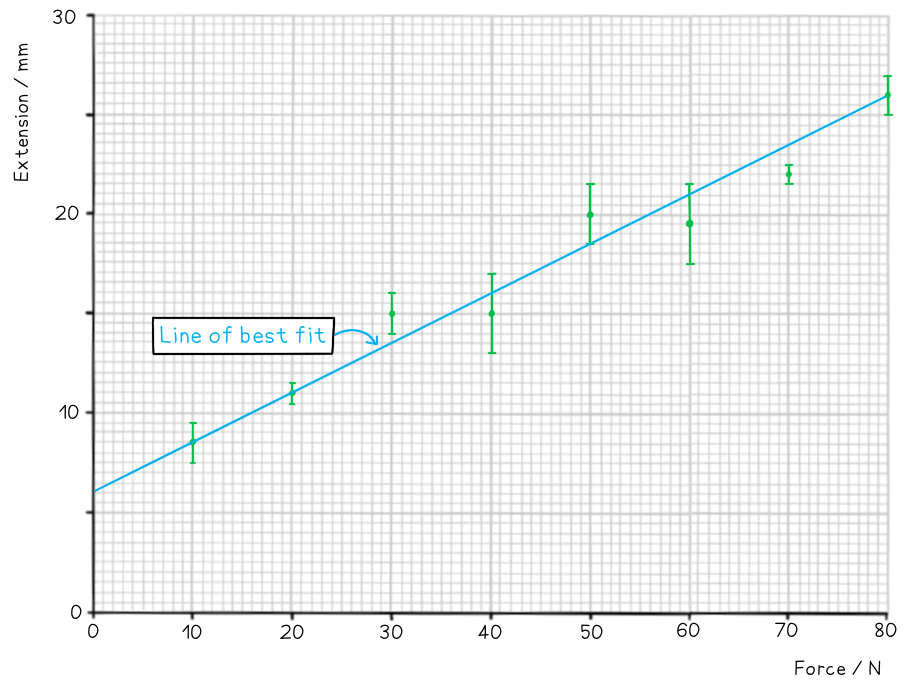
Step 4: Draw the line of worst fit
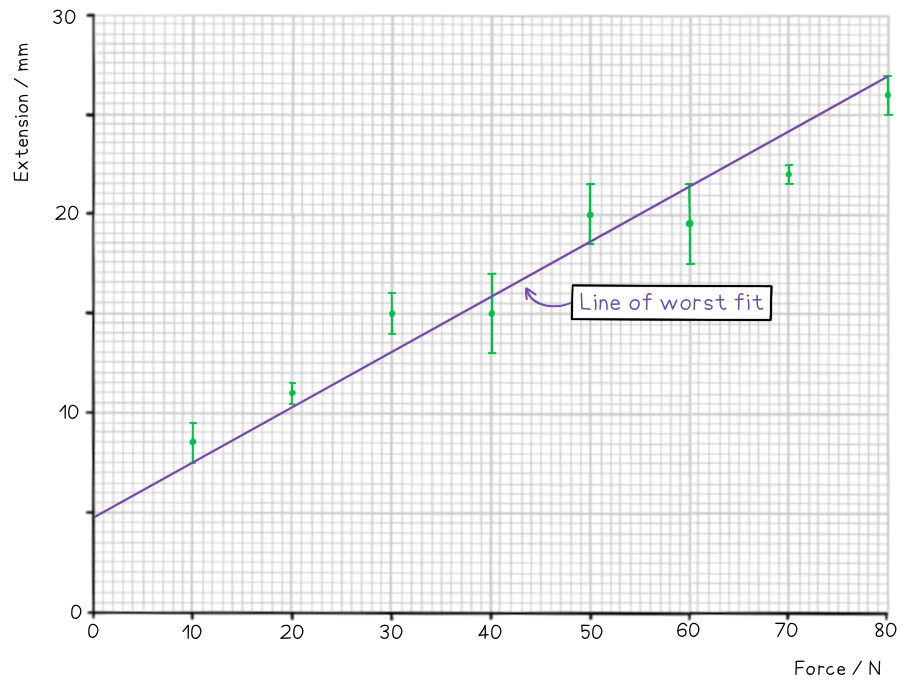
Step 5: Work out the gradient of each line and calculate the percentage uncertainty

转载自savemyexams

最新发布
© 2026. All Rights Reserved. 沪ICP备2023009024号-1


