- 翰林提供学术活动、国际课程、科研项目一站式留学背景提升服务!
- 400 888 0080
IB DP Biology: HL复习笔记3.3.3 Skills: Inheritance
Constructing Punnett Grids
- A monohybrid trait is one that is controlled by only one gene
- Generally, we consider that such a gene has two alleles
- Either: one allele is dominant and the other is recessive
- Or: the alleles are co-dominant
A monohybrid cross starts with pure-breeding parents (homozygous), each displaying a different phenotype
- The purpose of a Punnett grid is to predict the probability of a certain offspring displaying a certain genotype or phenotype
- In the case where multiple offspring are produced, Punnett grids can predict the numbers of offspring that will display a certain genotype or phenotype after a cross
Steps in constructing a Punnett Grid
- Write down the parental phenotypes and genotypes
- Write down all the possible gamete genotypes that each parent could produce for sexual reproduction
- A useful convention is to write the gamete genotypes inside a circle to denote them as gametes (haploid cells)
- Place each parental genotype against one axis of a Punnett grid (2 x 2 table)
- In the boxes of the Punnett grid, combine the gametes into the possible genotypes of the offspring
- This gives the offspring of the F1 generation (1st filial generation)
- List the phenotype and genotype ratios for the offspring
Worked Example
Sweet peas grow pods that are either green or yellow. The allele for green, G, is dominant to the allele for yellow, g.Construct a Punnett grid to predict the outcome when crossing green and yellow pure-bred plants to show the F1 generation offspring.Using plants from the F1 generation, construct a second Punnett grid to show the outcomes of the F2 generation.
Step 1: Write down the parental phenotype and genotypes
Green coloured pods Yellow coloured pods
GG gg
Step 2: Write down all the possible gamete genotypes that each parent could produce
 Step 3: Place each parental genotype against one axis of a Punnett grid (2 x 2 table)
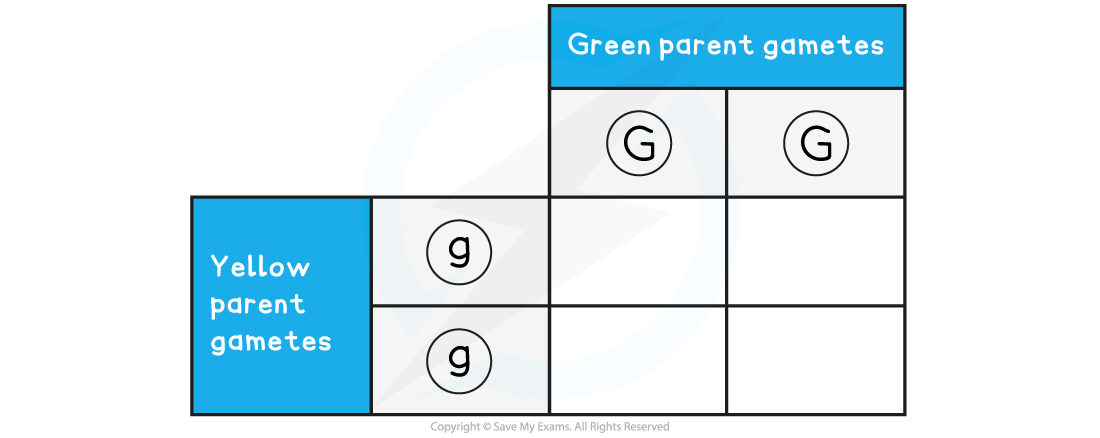
Step 4: Combine the gametes in each box of the Punnett grid
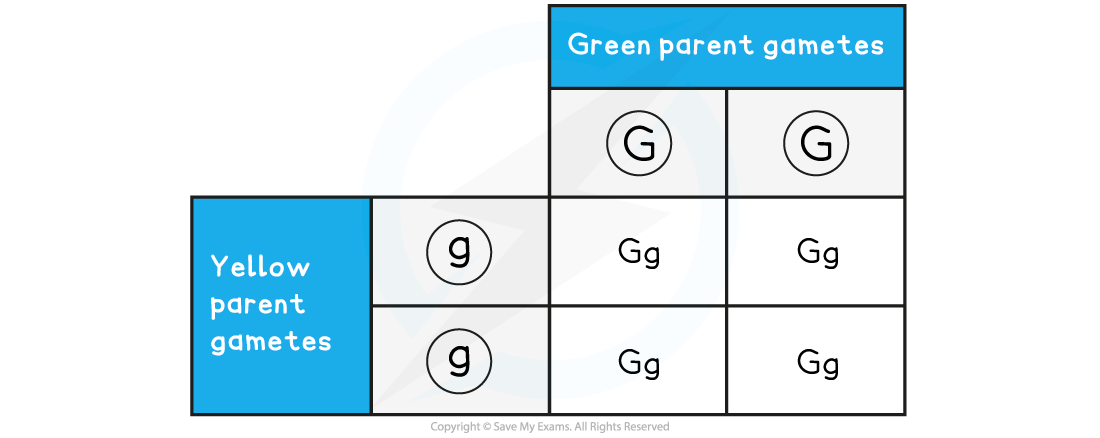 Genotypes of the F1 cross between homozygous green (GG) and homozygous yellow (gg) pea plants. All offspring (100%) have the genotype Gg and the phenotype is green.
Step 5: Take two heterozygous offspring from the F1 generation and cross them
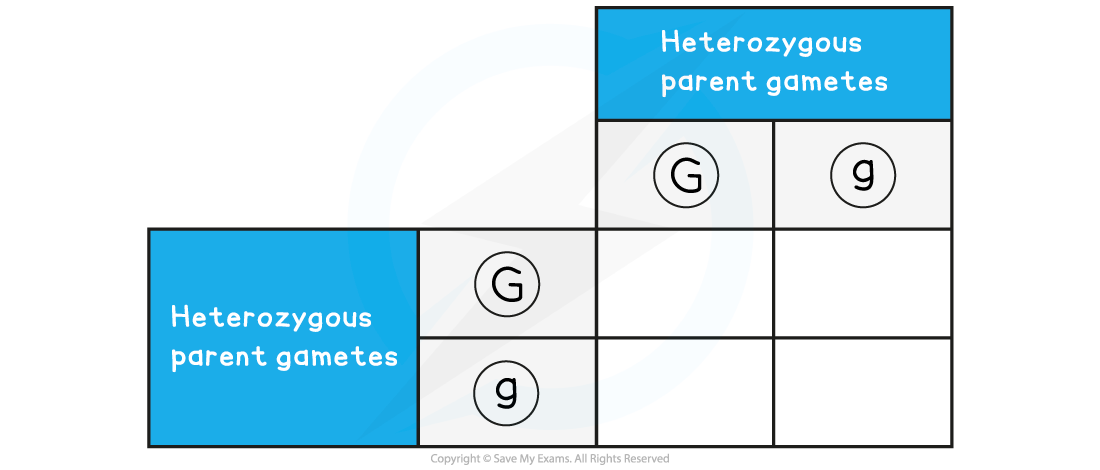
Step 6: Combine the gametes in each box of the Punnett grid
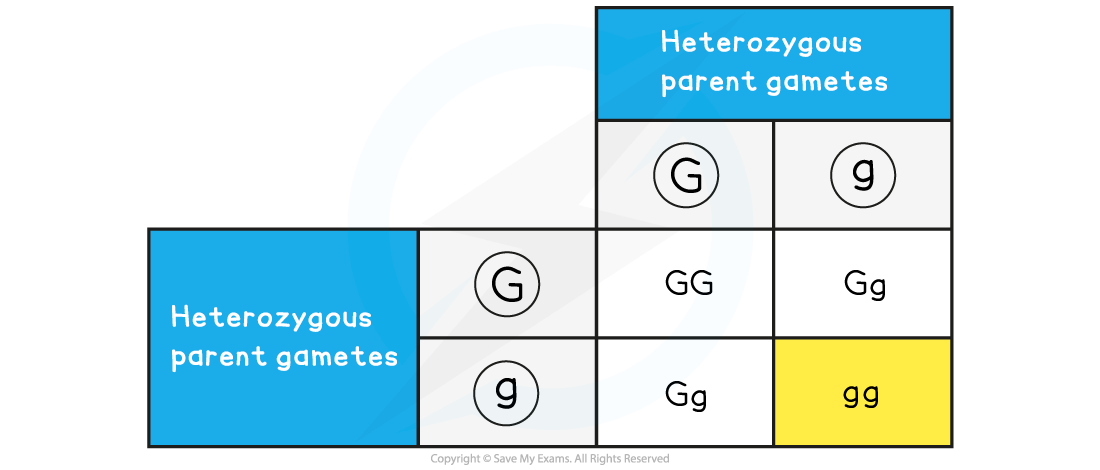
Punnett grid showing the results of the F2 generation
Phenotype ratio is 3:1 green:yellow, Genotype ratio is 1 GG: 2 Gg: 1 gg
Analysis of Genetic Crosses
Comparison of predicted and actual outcomes of genetic crosses using real data
- A Punnett grid diagram shows the possible combinations of alleles that could be produced in the offspring of a certain genetic cross
- From this, we can deduce the expected ratio of these combinations
- The actual outcome achieved from the cross often presents ratios different to those deduced in the punnet grid
- This is because there is an element of chance involved with inheritance
- The chi-squared test is a statistical test that can be used to determine whether the differences between the observed ratios and the expected ratios are significant or due to chance
Using pea plants to demonstrate the predicted outcomes of genetic crosses
- The height of pea plants is controlled by a single gene that has two alleles: tall and short
- The tall allele is dominant and is shown as T
- The small allele is recessive and is shown as t
- A pure breeding short plant is bred with a pure breeding tall plant
- The term ‘pure breeding’ indicates that the individual is homozygous for that characteristic
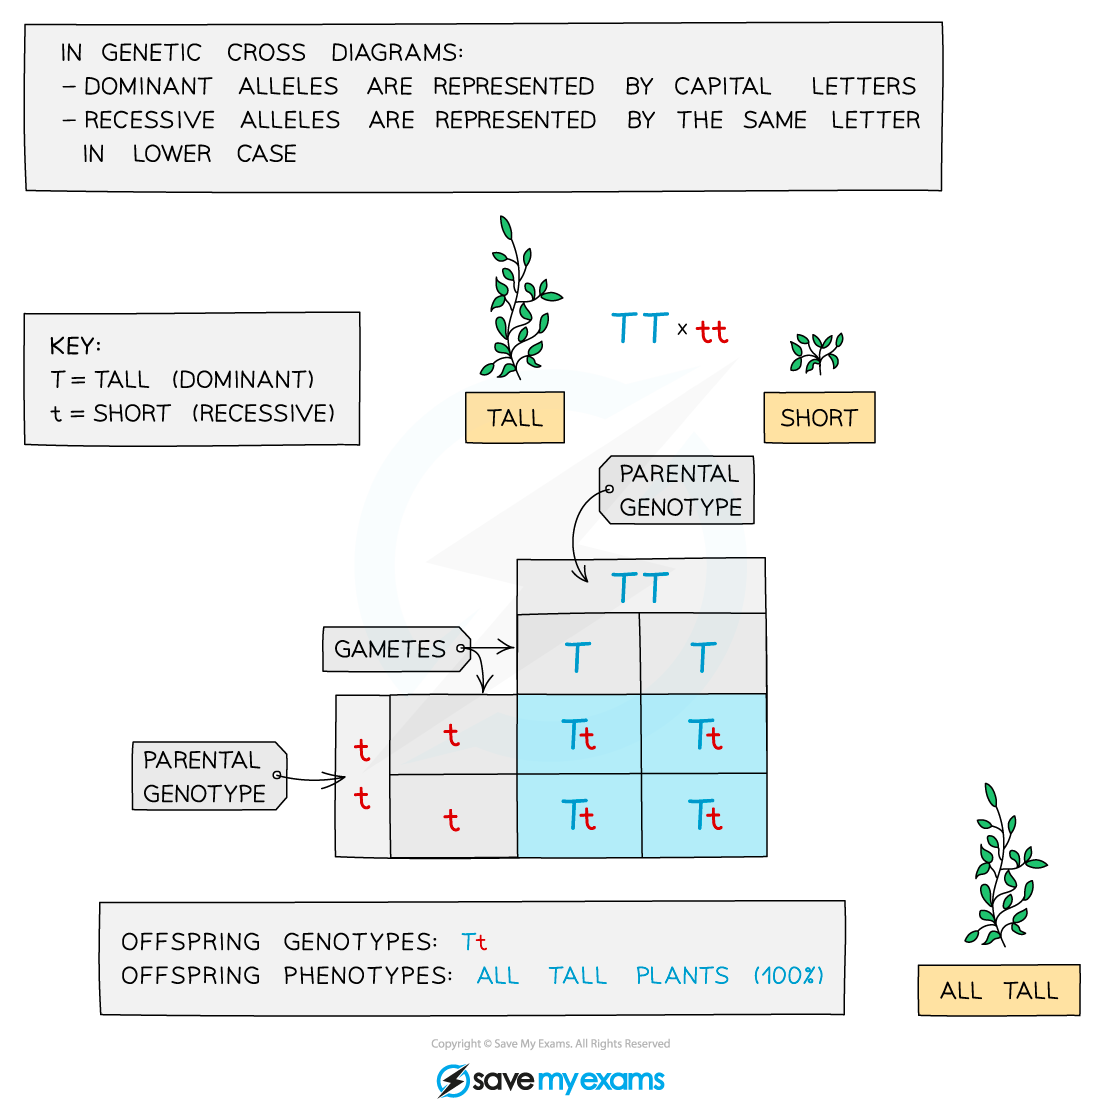
A pure-breeding genetic cross in pea plants. It shows that all offspring will be have the tall phenotype.
- Crossing the offspring from the first cross
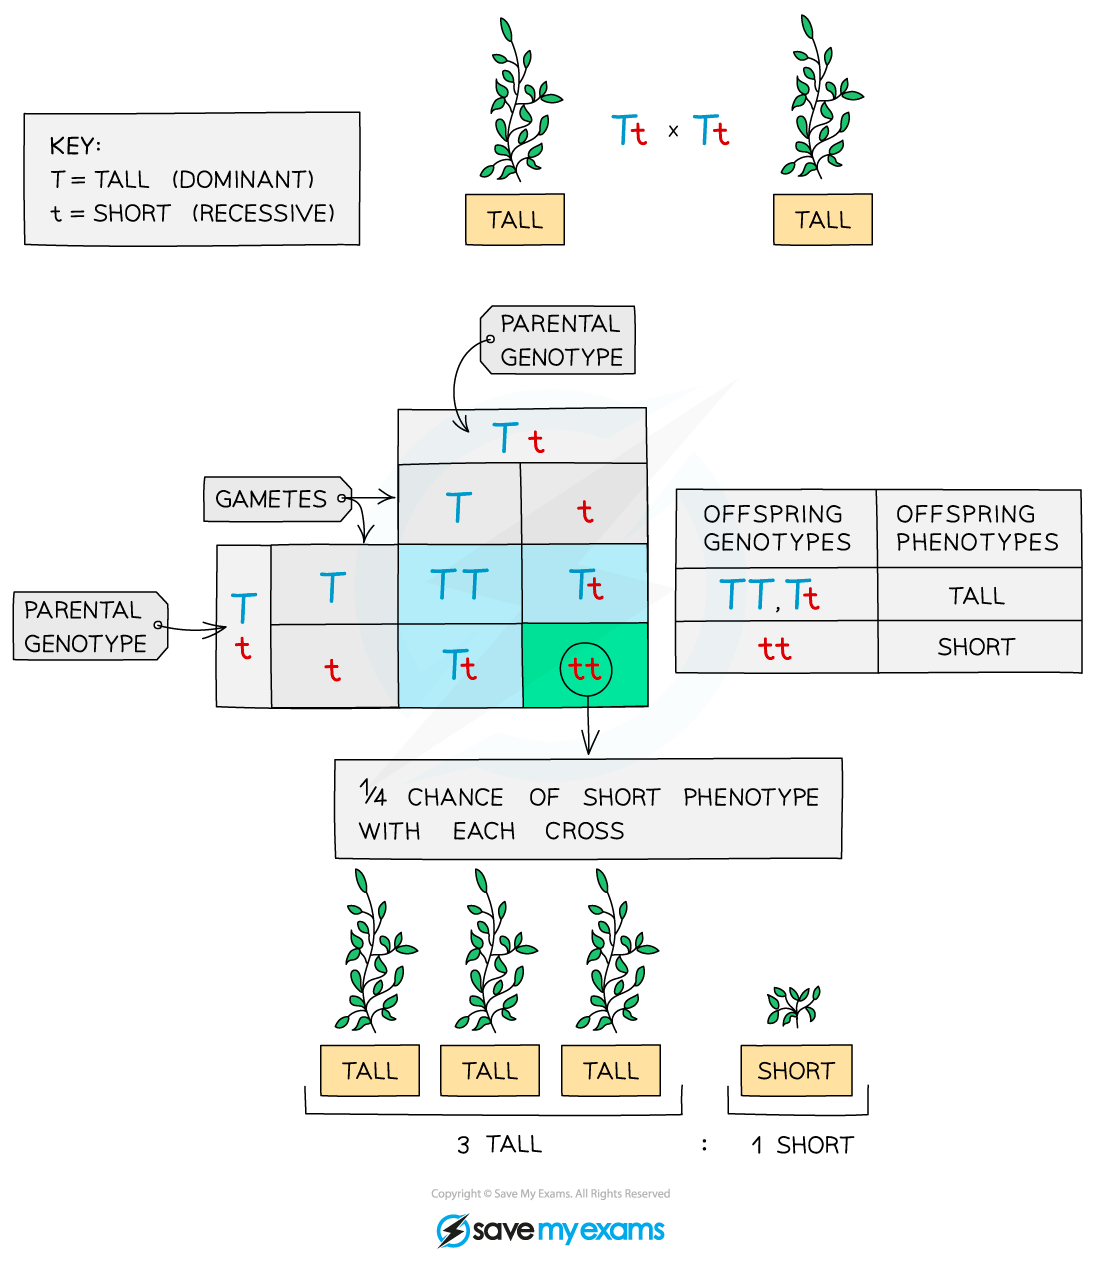
A genetic cross diagram (F2 generation). It shows a ratio of 3 tall : 1 short for any offspring.
- All of the offspring of the first cross have the same genotype, Tt (heterozygous), so the possible combinations of offspring bred from these are: TT (tall), Tt (tall), tt (short)
- There is more variation in the second cross, with a 3:1 ratio of tall : short
- The F2 generation is produced when the offspring of the F1 generation (pure-breeding parents) are allowed to interbreed
Crossing a heterozygous plant with a short plant
- The heterozygous plant will be tall with the genotype Tt
- The short plant is showing the recessive phenotype and so must be homozygous recessive – tt
- The results of this cross are as follows:
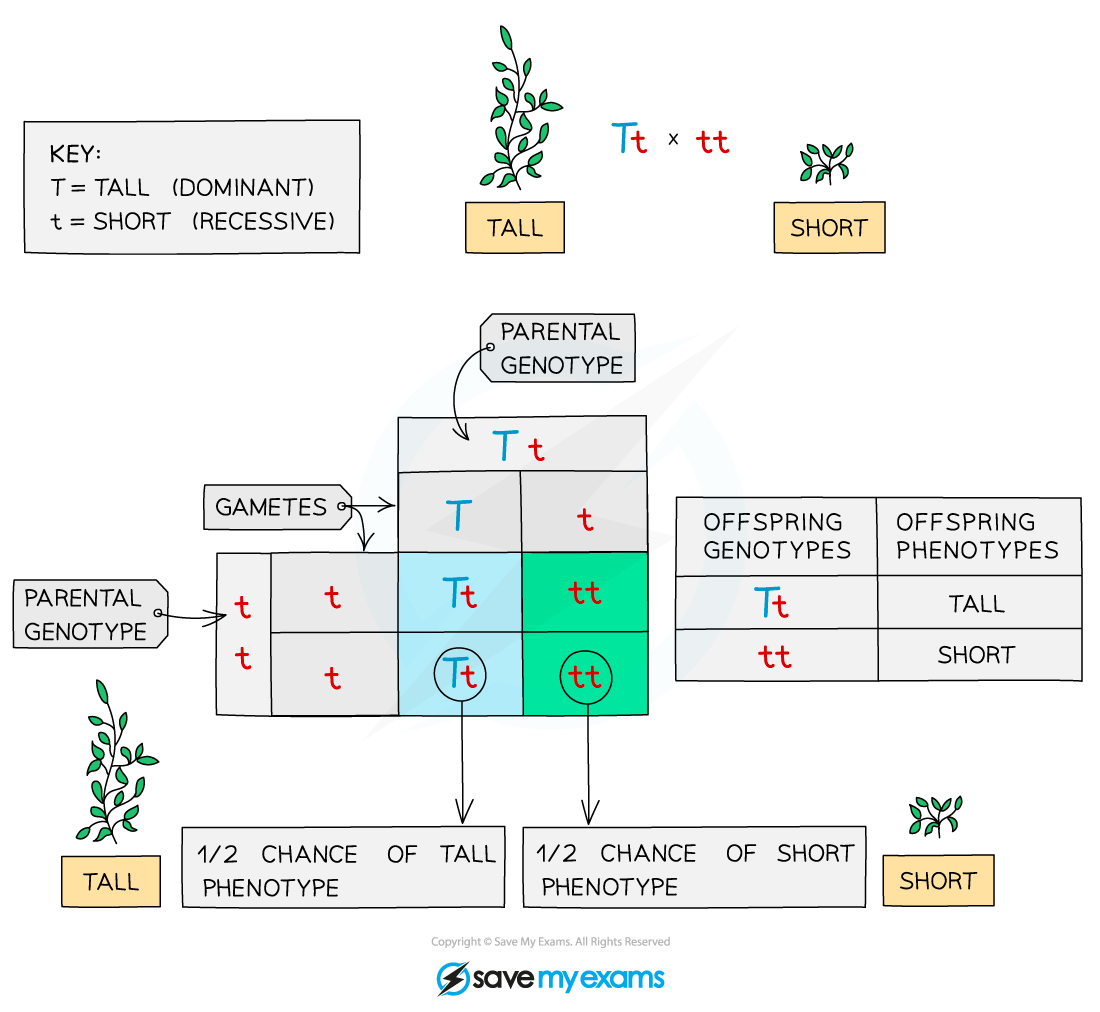
A cross between a heterozygous plant with a short plant
Exam Tip
If you are asked to use your own letters to represent the alleles in a Punnett grid, try to choose a letter that is obviously different as a capital than the lower case so the examiner is not left in any doubt as to which is dominant and which is recessive.
Pedigree Charts
- Family pedigree diagrams are usually used to trace the pattern of inheritance of a specific characteristic (usually a disease) through generations of a family
- This can be used to work out the probability that someone in the family will inherit the genetic disorder
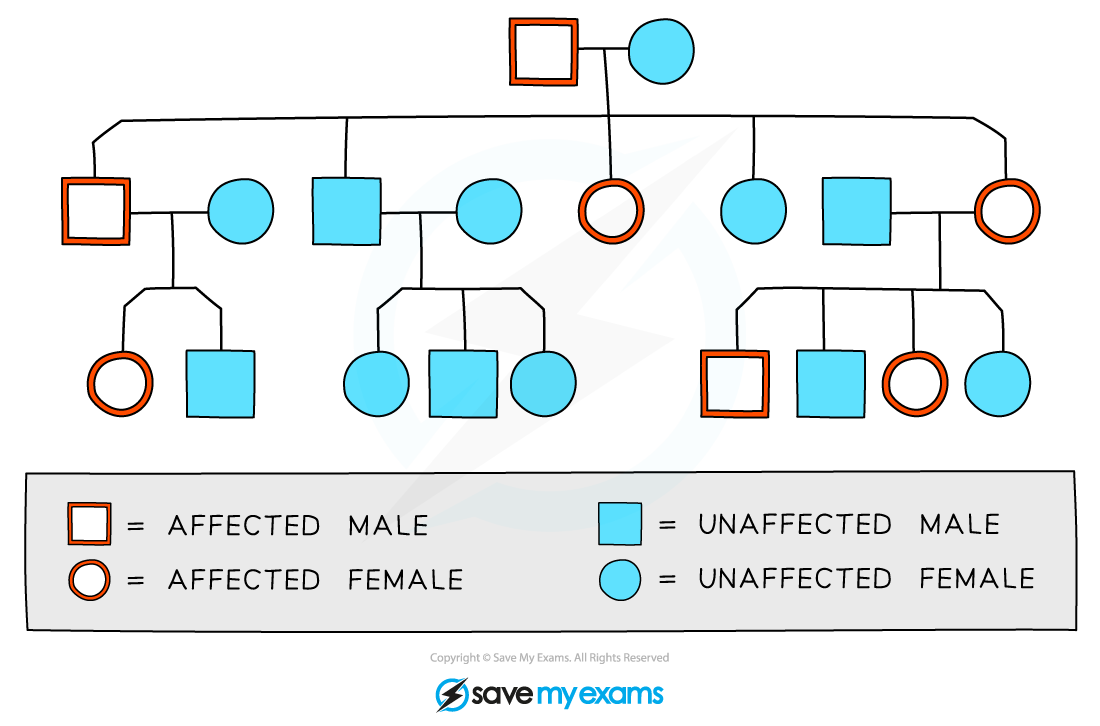
A family pedigree chart
- Males are indicated by the square shape and females are represented by circles
- In this diagram, affected individuals are red and unaffected are blue
- Shading or cross-hatching may also be used to show affected individuals
- Horizontal lines between males and females show that they have produced children (which are linked underneath each couple)
- Roman numerals may be used to indicate generations
- For each generation the eldest child is on the left and each individual is numbered
- The family pedigree above shows:
- both males and females are affected
- every generation has affected individuals
- The eldest son (in the second generation) is affected
- That there is one family group that has no affected parents or children
- the other two families have one affected parent and affected children as well
Worked Example
Worked example: Pedigree charts
- Below is a pedigree chart which traces the inheritance of albinism across several generations. Albinism affects the production of the pigment melanin leading to lighter hair, skin and eyes.
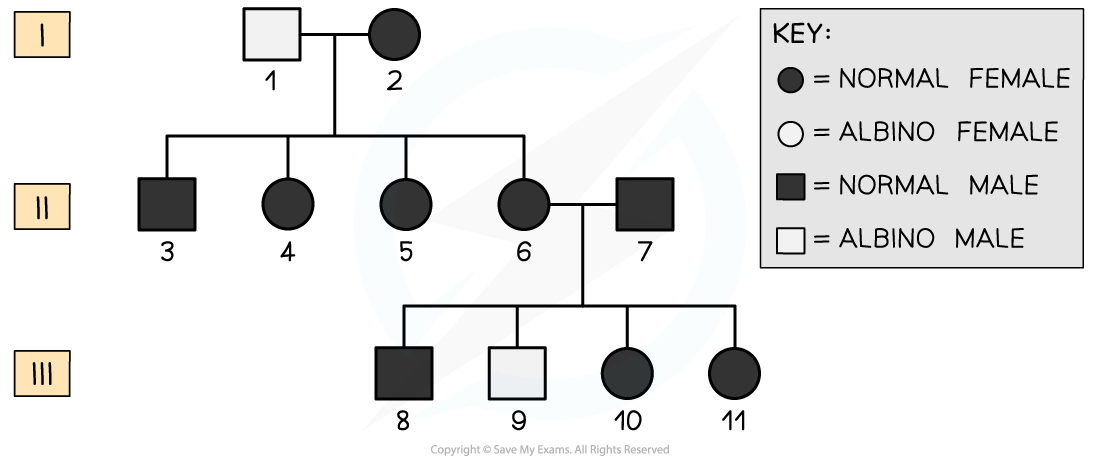
- Using the pedigree chart, deduce and explain the following:
- What type of allele causes albinism
- The genotype of individuals named 9 and 7
- The possible genotypes of 10 and 11
- Albinism is caused by a recessive allele
- Explanation: We can tell this from the pedigree chart because expression of the disease skips generation II. Also, person number 9 is an affected individual despite his parents (6 and 7) being unaffected. 6 and 7 must both be carriers of the recessive allele and 9 has inherited one recessive allele from each parent.
- It is unlikely to be a sex-linked disease as both females and males have the condition
- The genotype of person 9 must be homozygous recessive (aa) and the genotype of 7 must be heterozygous (Aa)
- Explanation: 9 is an affected individual with albinism (which is determined by the recessive allele). 7 must be heterozygous in order for him to pass on the recessive allele to person 9
- The possible genotypes of 10 and 11 are heterozygous (Aa) or homozygous dominant (AA)
- Explanation: This is because they are unaffected individuals so must possess at least one dominant allele (A), however, it is possible that they each inherited a dominant allele from each parent
Exam Tip
When answering questions about pedigree charts for genetic diseases, it is always useful to remember which phenotype is caused by the recessive allele. You can write these genotypes onto your chart and it will give you a good starting point for working out the possible genotypes of the rest of the individuals in the chart.
转载自savemyexams

最新发布
© 2026. All Rights Reserved. 沪ICP备2023009024号-1


