IB DP Maths: AI HL复习笔记4.11.2 Chi-squared Test for Independence

Chi-Squared Test for Independence
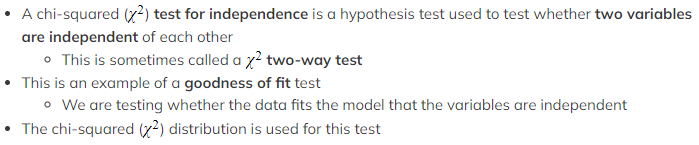
What is a chi-squared test for independence?
 You will use a contingency table
- This is a two-way table that shows the observed frequencies for the different combinations of the two variables
- For example: if the two variables are hair colour and eye colour then the contingency table will show the frequencies of the different combinations
- This is a two-way table that shows the observed frequencies for the different combinations of the two variables
Why might I have to combine rows or columns?
- The observed values are used to calculate expected values
- These are the expected frequencies for each combination assuming that the variables are independent
- Your GDC can calculate these for you after you input the observed frequencies
- These are the expected frequencies for each combination assuming that the variables are independent
- The expected values must all be bigger than 5
- If one of the expected values is less than 5 then you will have to combine the corresponding row or column in the matrix of observed values with the adjacent row or column
- The decision between row or column will be based on which seems the most appropriate
- For example: if the two variables are age and favourite TV genre then it is more appropriate to combine age groups than types of genre
- The decision between row or column will be based on which seems the most appropriate
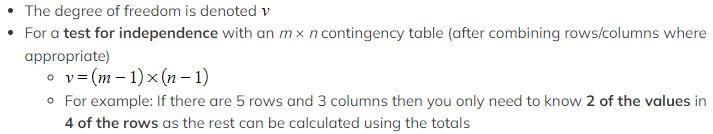
What is the degree of freedom?
- The degree of freedom refers to the minimum number of expected values you need to know in order to be able to calculate them all
 What are the steps for a chi-squared test for independence?
- STEP 1: Write the hypotheses
- H0 : Variable X is independent of variable Y
- H1 : Variable X is not independent of variable Y
- Make sure you clearly write what the variables are and don’t just call them X and Y
- STEP 2: Calculate the degree of freedom for the test
- For an m × n contingency table
 STEP 4: Decide whether there is evidence to reject the null hypothesis
- EITHER compare the χ² statistic with the given critical value
- If χ² statistic > critical value then reject H0
- If χ² statistic < critical value then accept H0
- OR compare the p-value with the given significance level
- If p-value < significance level then reject H0
- If p-value > significance level then accept H0
- EITHER compare the χ² statistic with the given critical value
- STEP 5: Write your conclusion
- If you reject H0
- There is sufficient evidence to suggest that variable X is not independent of variable Y
- Therefore this suggests they are associated
- If you accept H0
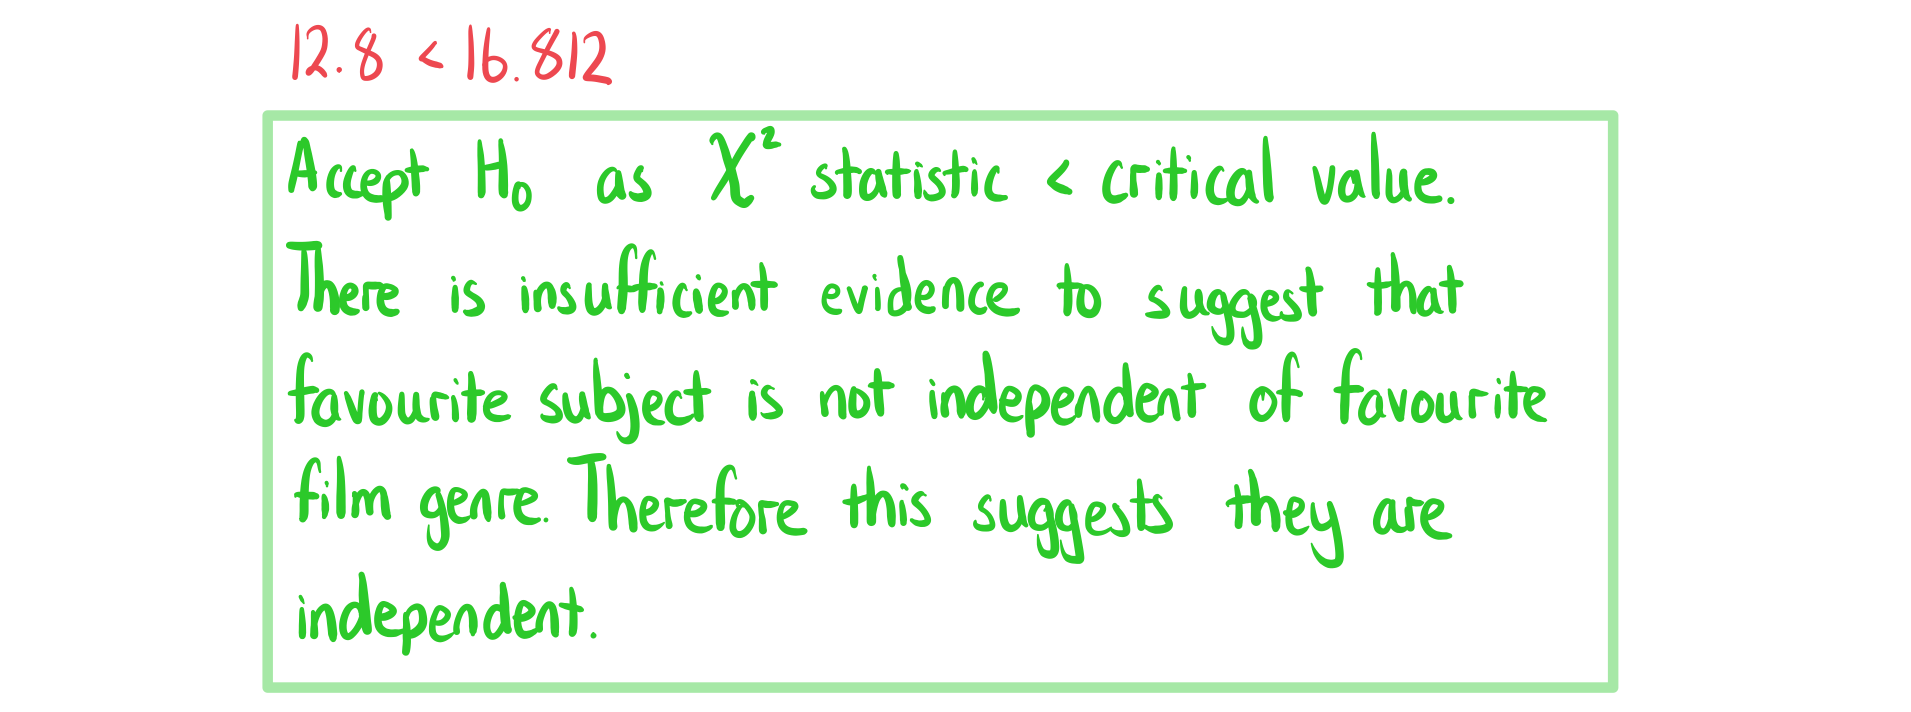
- There is insufficient evidence to suggest that variable X is not independent of variable Y
- Therefore this suggests they are independent
- If you reject H0
How do I calculate the chi-squared statistic?
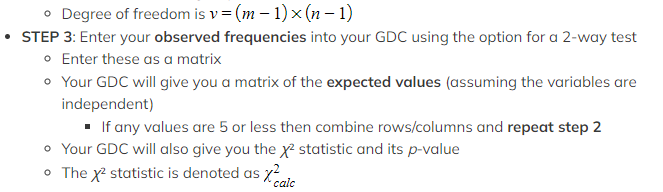
- You are expected to be able to use your GDC to calculate the χ² statistic by inputting the matrix of the observed frequencies
- Seeing how it is done by hand might deepen your understanding but you are not expected to use this method
- STEP 1: For each observed frequency Oi calculate its expected frequency Ei
- Assuming the variables are independent
-
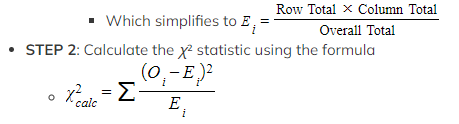 You do not need to learn this formula as your GDC calculates it for you
- To calculate the p-value you would find the probability of a value being bigger than your χ² statistic using a χ² distribution with ν degrees of freedom
Exam Tip
Note for Internal Assessments (IA)
- If you use a χ² test in your IA then beware that the outcome may not be accurate if there is only 1 degree of freedom
- This means it is a 2 × 2 contingency table
Worked Example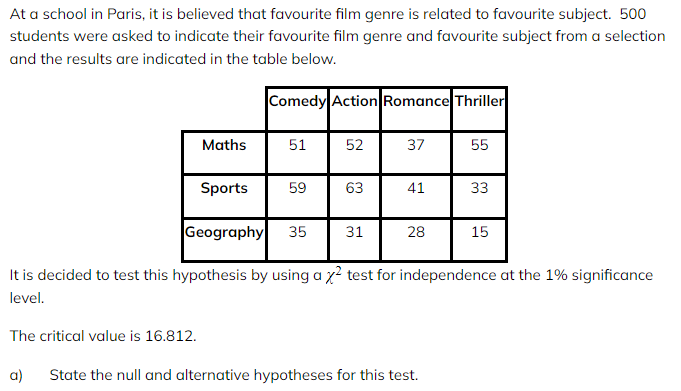
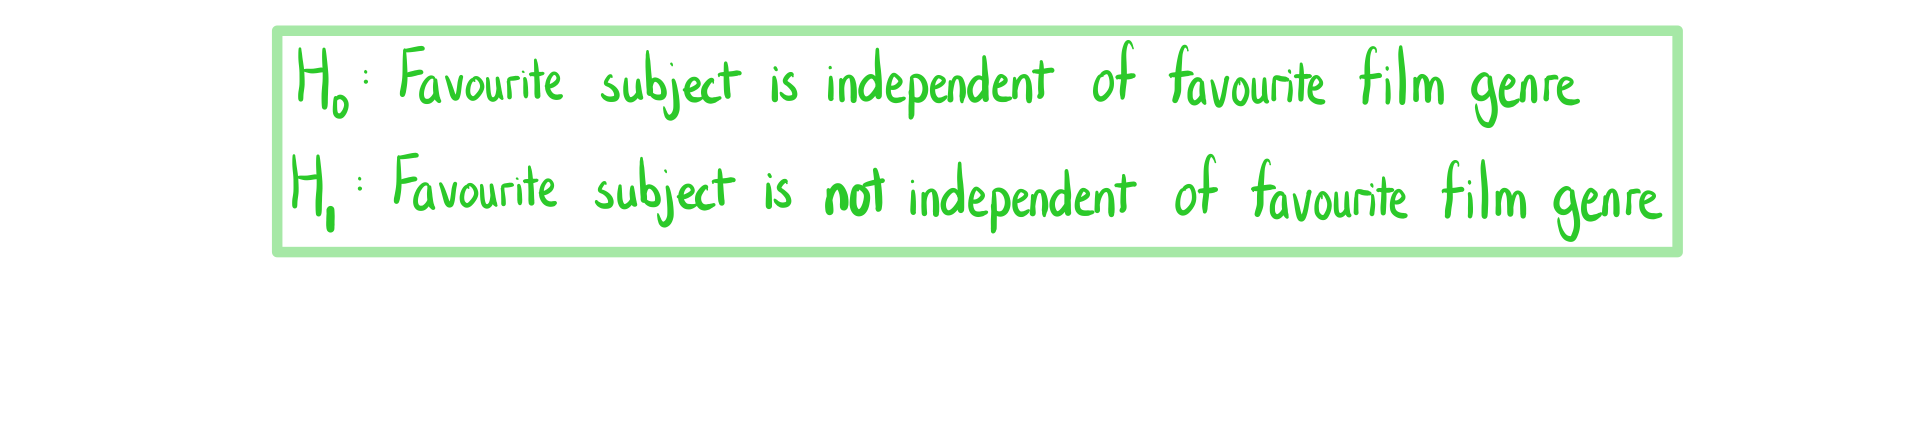 b)Write down the number of degrees of freedom for this table.
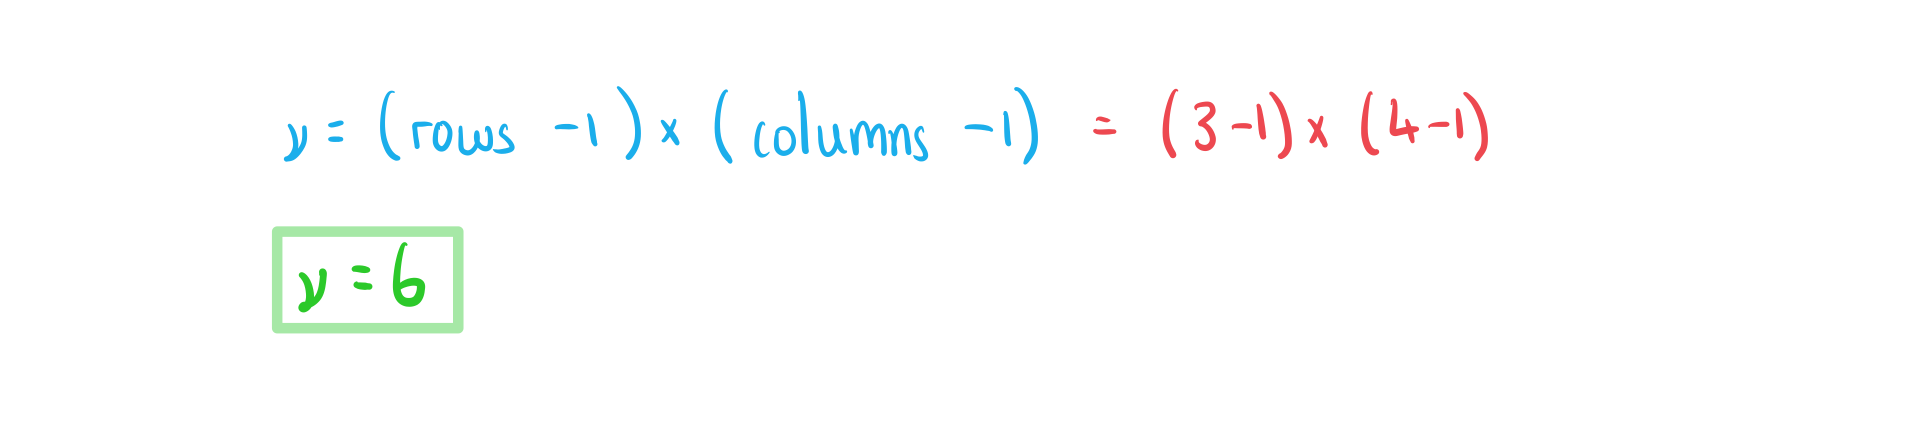
![]()
d)Write down the conclusion to the test. Give a reason for your answer.
转载自savemyexams

翰林AMC8视频课重磅上线!

国际竞赛真题资源免费领取


