IB DP Maths: AI SL复习笔记4.2.2 Correlation Coefficients

PMCC
What is Pearson’s product-moment correlation coefficient?
- Pearson’s product-moment correlation coefficient (PMCC) is a way of giving a numerical value to a linear relationship of bivariate data
- A positive value of r describes positive correlation
- A negative value of r describes negative correlation
- r = 0 means there is no linear correlation
- r = 1 means perfect positive linear correlation
- r = -1 means perfect negative linear correlation
- The closer to 1 or -1 the stronger the correlation
How do I calculate Pearson’s product-moment correlation coefficient (PMCC)?
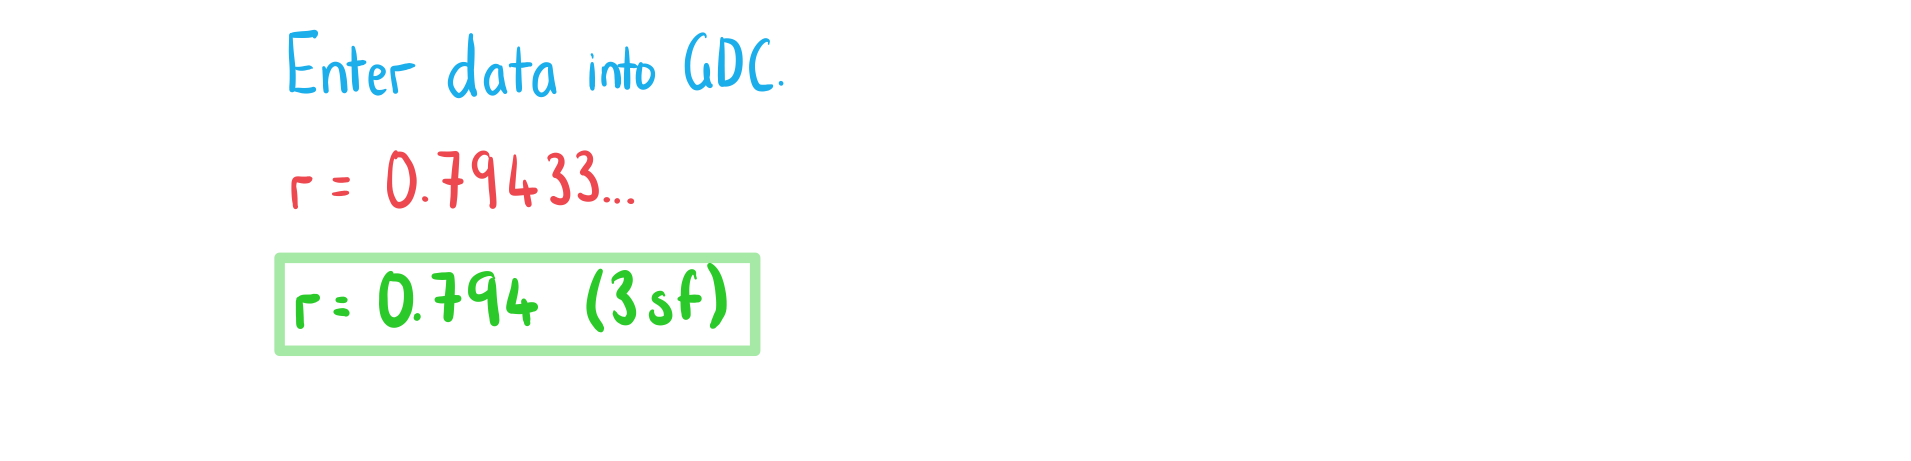
- You will be expected to use the statistics mode on your GDC to calculate the PMCC
- The formula can be useful to deepen your understanding
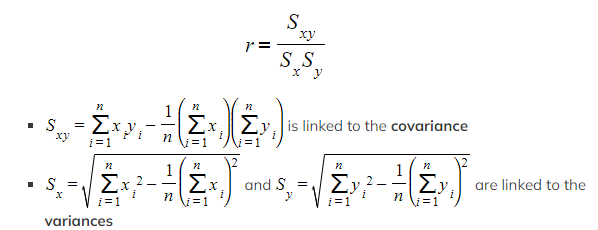
-
- You do not need to learn this as using your GDC will be expected
When does the PMCC suggest there is a linear relationship?
- Critical values of r indicate when the PMCC would suggest there is a linear relationship
- In your exam you will be given critical values where appropriate
- Critical values will depend on the size of the sample
- If the absolute value of the PMCC is bigger than the critical value then this suggests a linear model is appropriate
Spearman’s Rank
What is Spearman’s rank correlation coefficient?
- Each data is ranked from biggest to smallest
- For n data values they are ranked from 1 to n
- 1 for the biggest x-value and 1 for the biggest y-value
- Spearman’s rank correlation coefficient is a way to measure linear correlation between the rankings of the data
- A positive value of rs describes a degree of agreement between the rankings
- A negative value of rs describes a degree of disagreement between the rankings
- rs = 0 means there is no correlation between the rankings
- rs = 1 means the rankings are in complete agreement
- An increase in one variable means an increase in the other
- rs = -1 means the rankings are in complete disagreement
- An increase in one variable means a decrease in the other
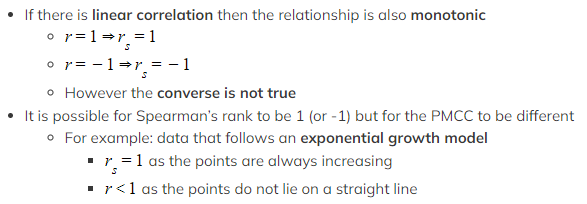
- If rs = 1 or rs = -1 then the data is said to have a monotonic relationship
- This means either the points are always increasing or always decreasing
- The closer to 1 or -1 the stronger the correlation of the rankings
How do I calculate Spearman’s rank correlation coefficient (PMCC)?
- Rank each set of data independently
- 1 to n for the x-values
- 1 to n for the y-values
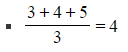
- If some values are equal then give each the average of the ranks they would occupy
- For example: if the 3rd, 4th and 5th highest values are equal then give each the ranking of 4
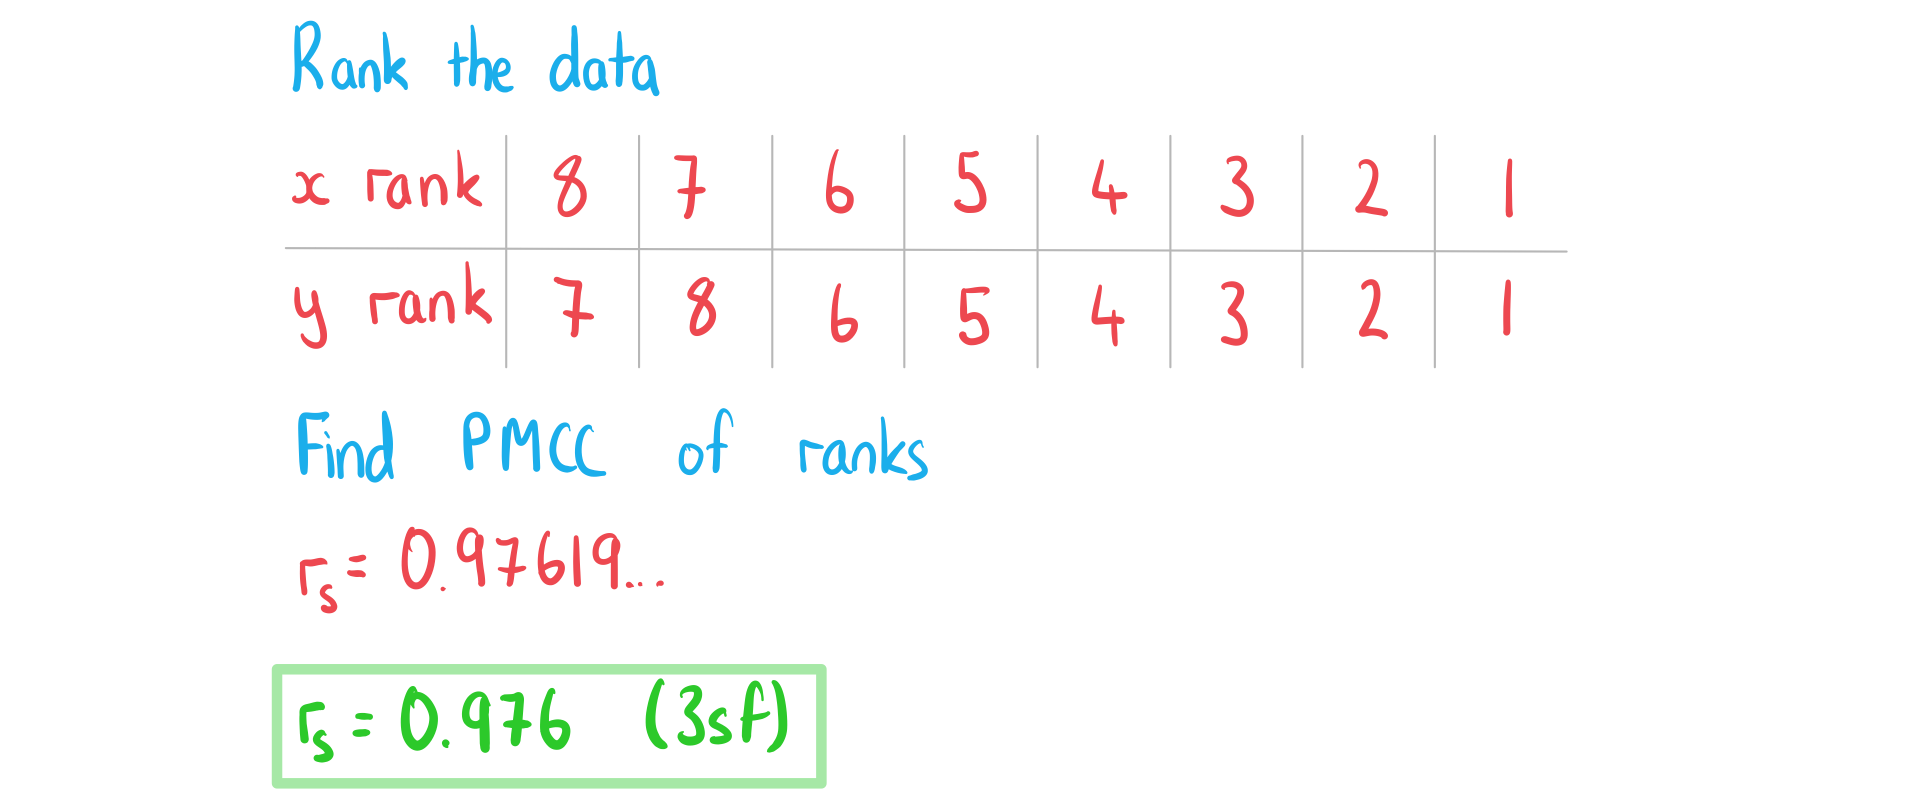
 Calculate the PMCC of the rankings using your GDC
- This value is Spearman's rank correlation coefficient
Appropriateness & Limitations
Which correlation coefficient should I use?
- Pearson’s PMCC tests for a linear relationship between two variables
- It will not tell you if the variables have a non-linear relationship
- Such as exponential growth
- Use this if you are interested in a linear relationship
- It will not tell you if the variables have a non-linear relationship
- Spearman’s rank tests for a monotonic relationship (always increasing or always decreasing) between two variables
- It will not tell you what function can be used to model the relationship
- Both linear relationships and exponential relationships can be monotonic
- Use this if you think there is a non-linear monotonic relationship
- It will not tell you what function can be used to model the relationship
How are Pearson’s and Spearman’s correlation coefficients connected?
 Are Pearson’s and Spearman’s correlation coefficients affected by outliers?
- Pearson’s PMCC is affected by outliers
- as it uses the numerical value of each data point
- Spearman’s rank is not usually affected by outliers
- as it only uses the ranks of each data point
Exam Tip
- You can use your GDC to plot the scatter diagram to help you visualise the data
Worked Example
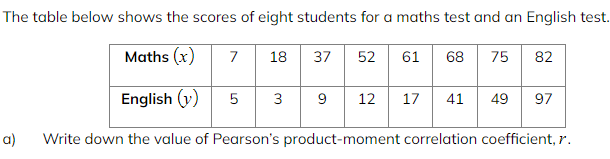
![]()
c)Comment on the values of the two correlation coefficients.

转载自savemyexams

国际竞赛真题资料-点击免费领取!

美高学分项目重磅来袭!立即了解