- 翰林提供学术活动、国际课程、科研项目一站式留学背景提升服务!
- 400 888 0080
IB DP Maths: AI SL复习笔记2.3.1 Linear & Piecewise Models
Linear Models
What are the parameters of a linear model?
 The m represents the rate of change of the function
- This is the amount the function increases/decreases when x increases by 1
- If the function is increasing m is positive
- If the function is decreasing m is negative
- When the model is represented as a graph this is the gradient of the line
- This is the amount the function increases/decreases when x increases by 1
- The c represents the value of the function when x = 0
- This is the value of the function when the independent variable is not present
- This is usually referred to as the initial value
- When the model is represented as a graph this is the y-intercept of the line
What can be modelled as a linear model?
- If the graph of the data resembles a straight line
- Anything with a constant rate of change
- C(d) is the taxi charge for a journey of d km
- B(m) is the monthly mobile phone bill when m minutes have been used
- R(d) is the rental fee for a car used for d days
- d(t) is the distance travelled by a car moving at a constant speed for t seconds
What are possible limitations of a linear model?
- Linear models continuously increase (or decrease) at the same rate
- In real-life this might not be the case
- The function might reach a maximum (or minimum)
- If the value of m is negative then for some inputs the function will predict negative values
- In some real-life situations negative values will not make sense
- To overcome this you can decide on an appropriate domain so that the outputs are never negative
Exam Tip
- Make sure that you are equally confident in working with linear models both algebraically and graphically as it may be easier using one method over the other when tackling a particular exam question
Worked Example
 a)Calculate the cost of the gym membership for 20 weeks.
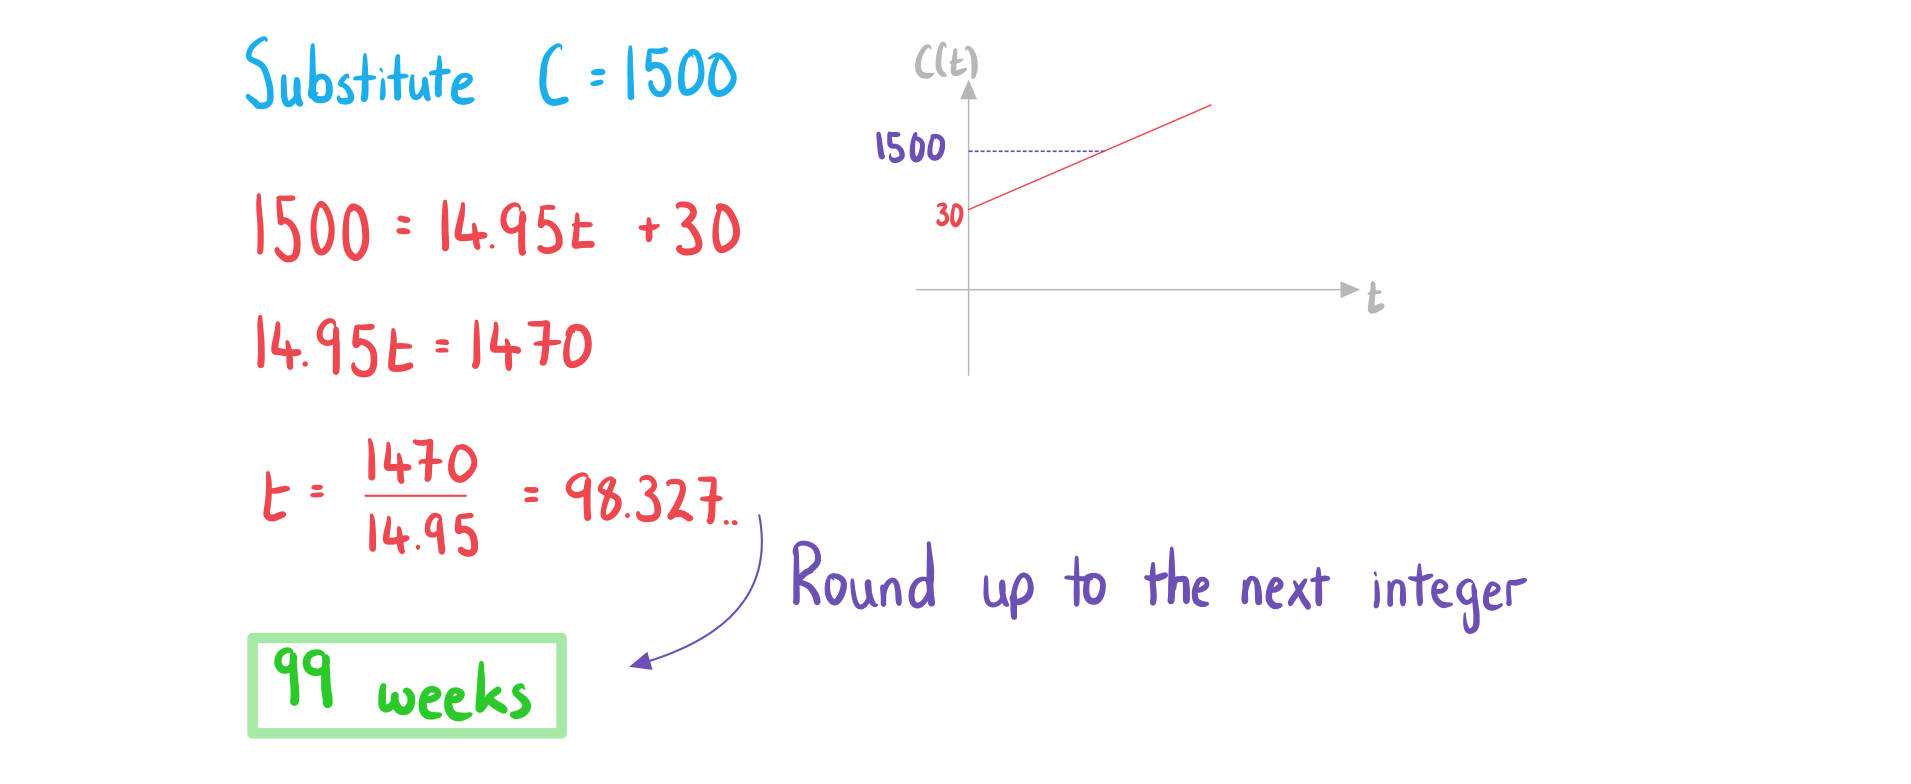
b)Find the number of weeks it takes for the total cost to exceed 1500 NZD.

c)Under new management, FitFirst changes the initial payment to 20 NZD and the weekly cost to 19.25 NZD. Write the new cost function after these changes have been.
 Linear Piecewise Models
What are the parameters of a piecewise linear model?
 For each linear model there will be
- The rate of change for that interval mi
- The value if the independent variable was not present ci
What can be modelled as a piecewise linear model?
- Piecewise linear models can be used when the rate of change of a function changes for different intervals
- These commonly apply when there are different tariffs or levels of charges
- Anything with a constant rate of change for set intervals
- C(d) is the taxi charge for a journey of d km
- The charge might double after midnight
- R(d) is the rental fee for a car used for d days
- The daily fee might triple if the car is rented over bank holidays
- s(t) is the speed of a car travelling for t seconds with constant acceleration
- The car might reach a maximum speed
- C(d) is the taxi charge for a journey of d km
What are possible limitations of a piecewise linear model?
- Linear models have a constant rate of change
- In real-life this might not be the case
- A function might increase (or decrease) gradually rather than at a constant rate
Exam Tip
- Make sure that you know how to plot a piecewise model on your GDC
Worked Example
a)Find the total monthly charge if 80 minutes have been used.

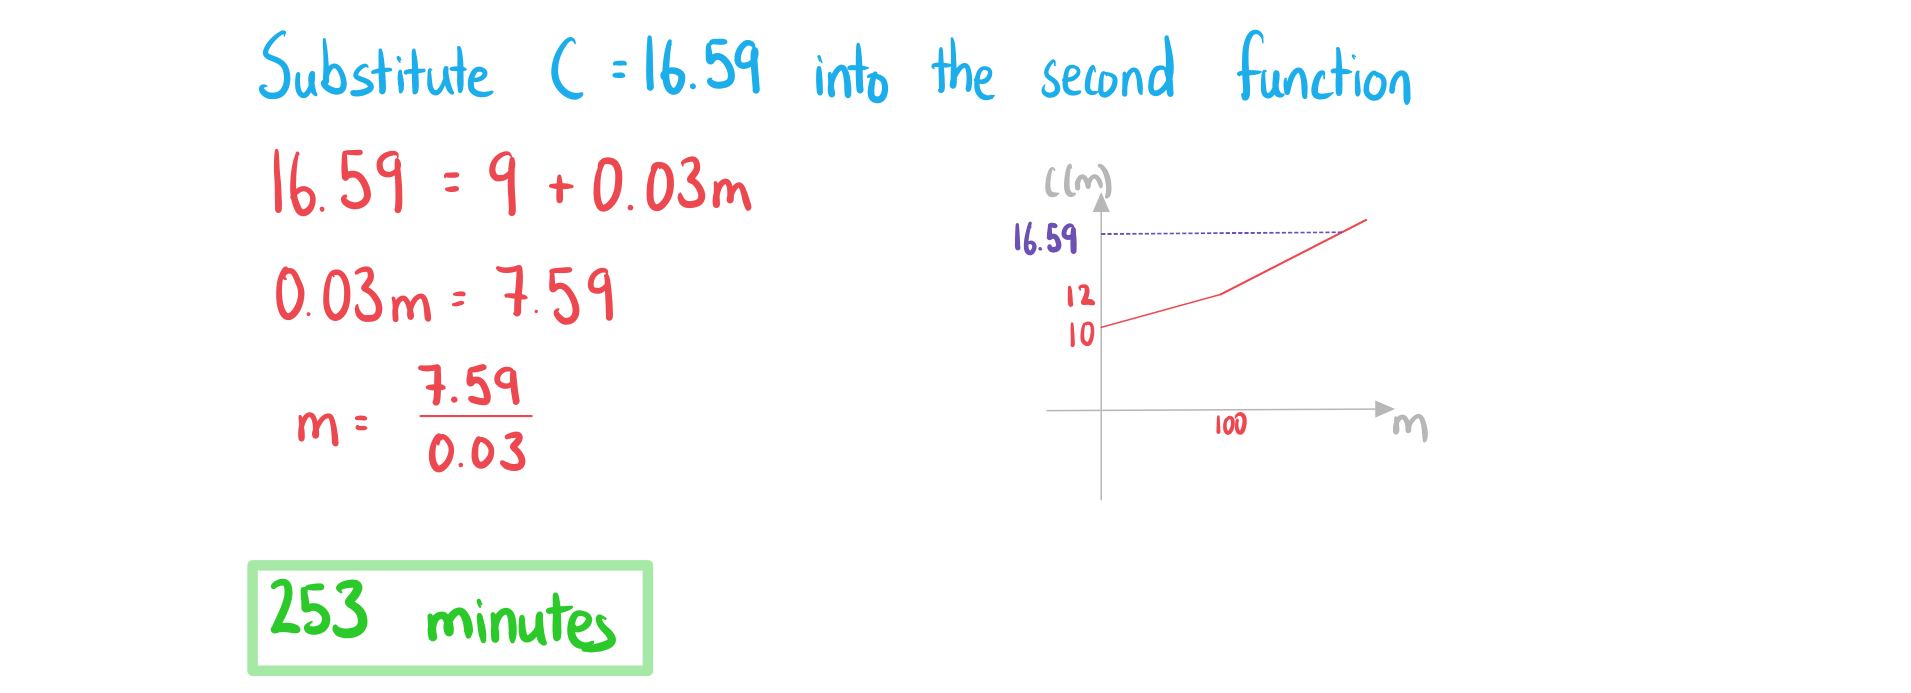
b)Given that the total monthly charge is £16.59, find the number of minutes that were used.

转载自savemyexams

最新发布
© 2025. All Rights Reserved. 沪ICP备2023009024号-1


