- 翰林提供学术活动、国际课程、科研项目一站式留学背景提升服务!
- 400 888 0080
Edexcel IGCSE Physics 复习笔记 1.1.5 Velocity-Time Graphs
Edexcel IGCSE Physics 复习笔记 1.1.5 Velocity-Time Graphs
Velocity-Time Graphs
- A velocity-time graph shows how the velocity of a moving object varies with time
- The red line represents an object with increasing velocity
- The green line represents an object with decreasing velocity
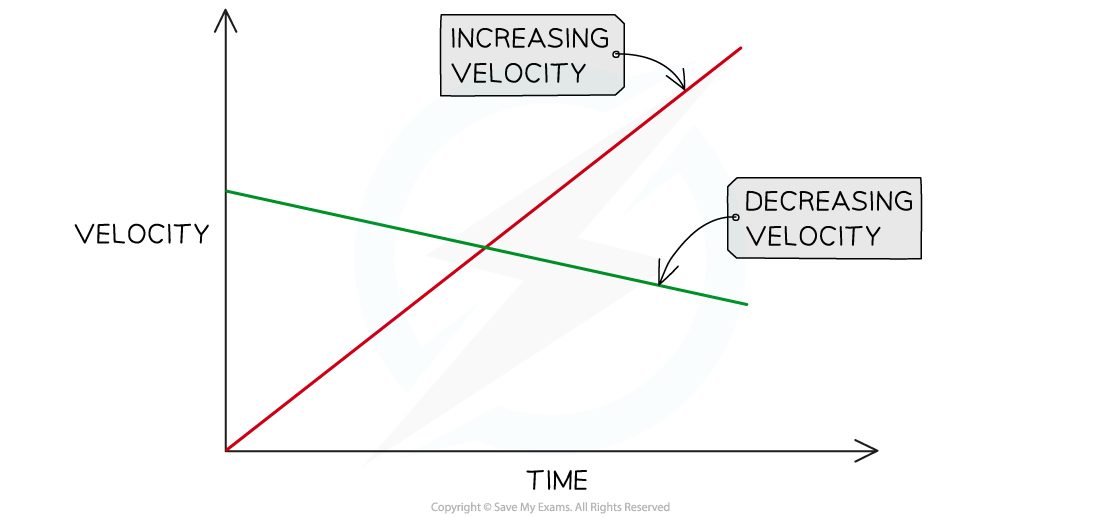
Increasing and decreasing velocity represented on a velocity-time graph
Acceleration on a Velocity-Time Graph
- Velocity-time graphs also show the following information:
- If the object is moving with a constant acceleration/deceleration
- The magnitude of the acceleration/deceleration
- A straight line represents constant acceleration
- The slope of the line represents the magnitude of acceleration
- A steep slope means large acceleration (or deceleration) - i.e. the object's speed changes very quickly
- A gentle slope means small acceleration (or deceleration) - i.e. the object's speed changes very gradually
- A flat line means the acceleration is zero - i.e. the object is moving with a constant velocity
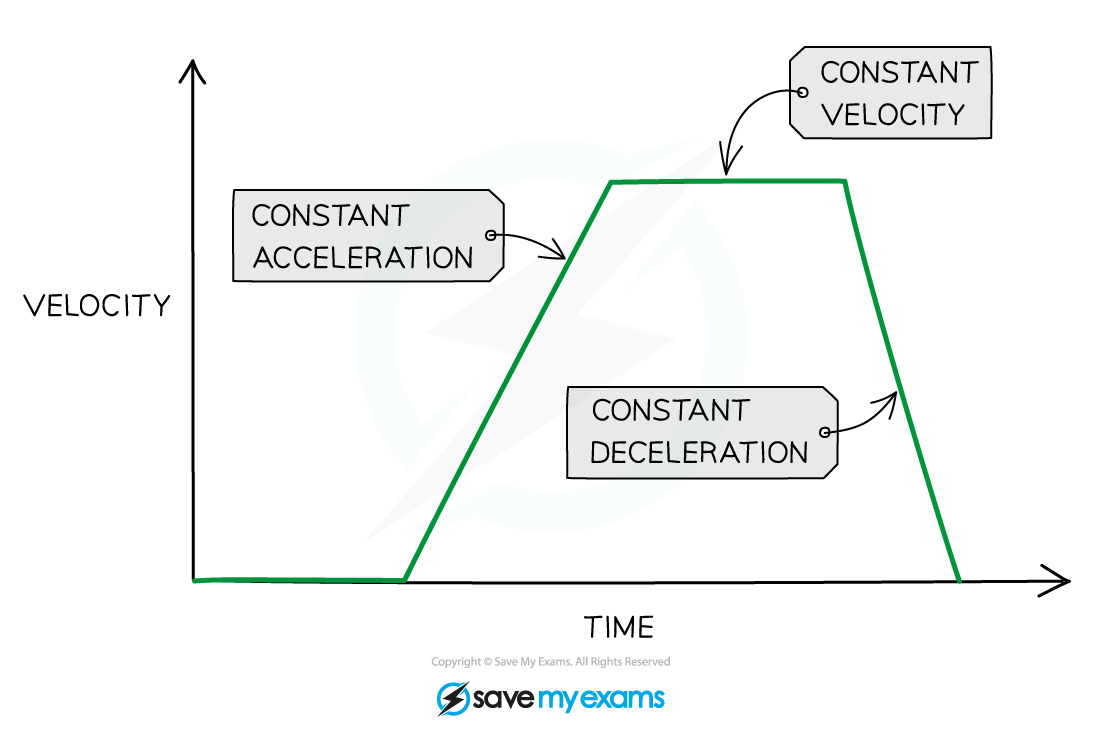
This image shows how to interpret the slope of a velocity-time graph
Gradient of a Velocity-Time Graph
- The acceleration of an object can be calculated from the gradient of a velocity-time graph

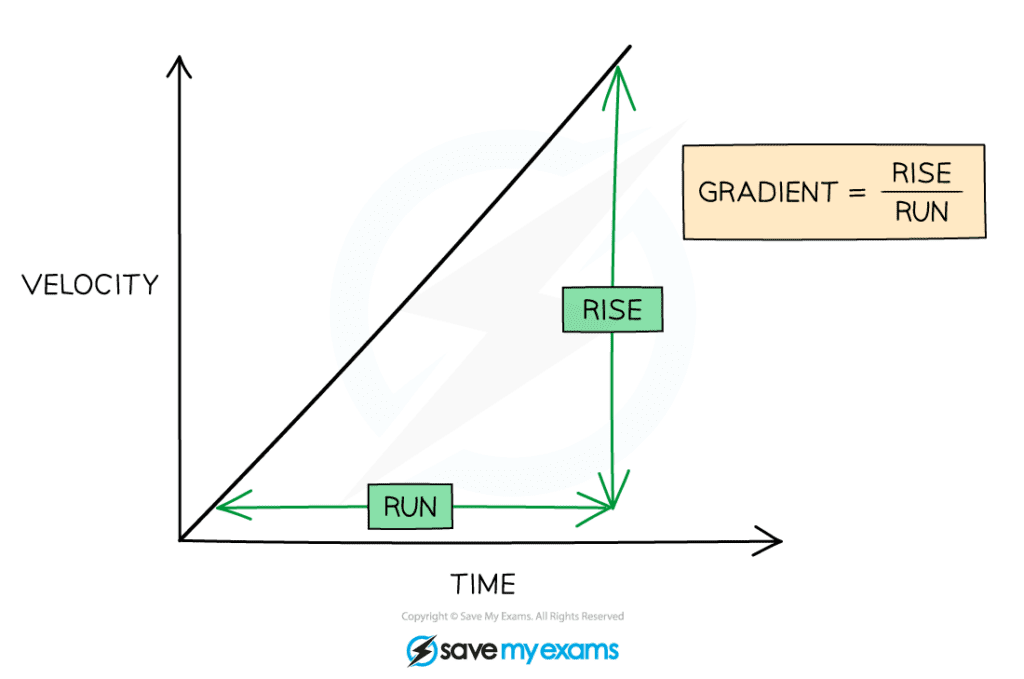
How to find the gradient of a velocity-time graph
Worked Example
Tora is training for a cycling tournament.
The velocity-time graph below shows her motion as she cycles along a flat, straight road.
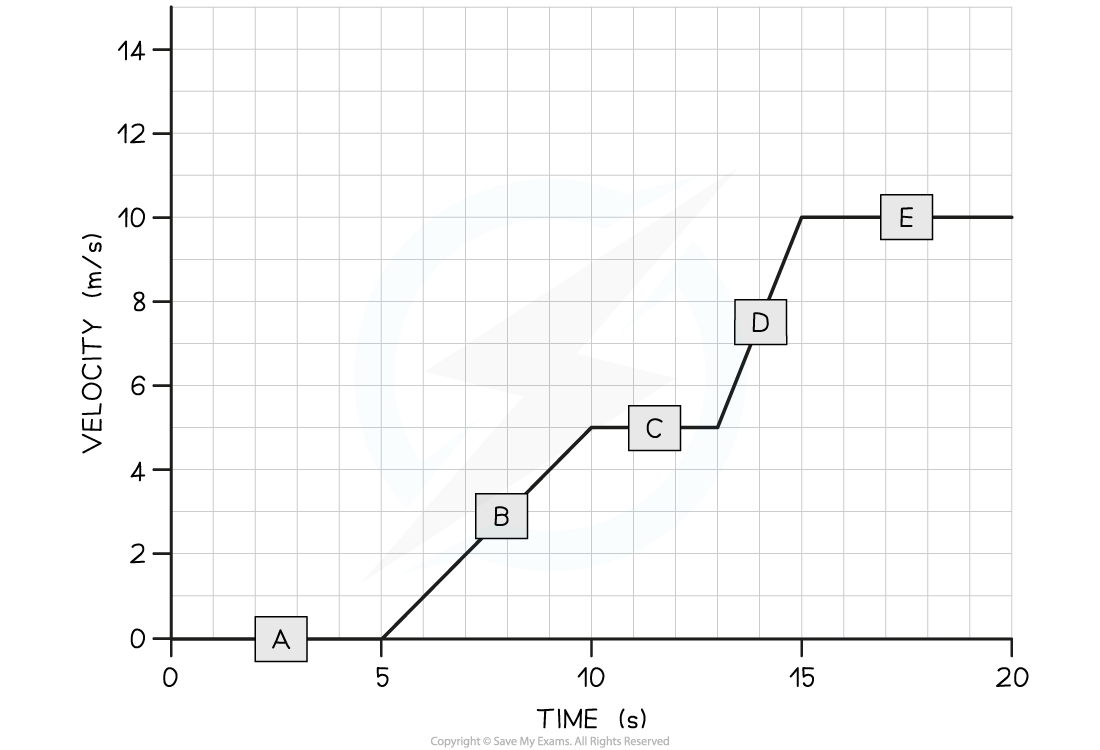
(a) In which section (A, B, C, D, or E) of the velocity-time graph is Tora’s acceleration the largest?(b) Calculate Tora’s acceleration between 5 and 10 seconds.
Part (a)
Step 1: Recall that the slope of a velocity-time graph represents the magnitude of acceleration
-
- The slope of a velocity-time graph indicates the magnitude of accelerationTherefore, the only sections of the graph where Tora is accelerating is section B and section D
- Sections A, C, and E are flat – in other words, Tora is moving at a constant velocity (i.e. not accelerating)
Step 2: Identify the section with the steepest slope
-
- Section D of the graph has the steepest slope
Hence, the largest acceleration is shown in section D
- Section D of the graph has the steepest slope
Part (b)
Step 1: Recall that the gradient of a velocity-time graph gives the acceleration
-
- Calculating the gradient of a slope on a velocity-time graph gives the acceleration for that time period
Step 2: Draw a large gradient triangle at the appropriate section of the graph
-
- A gradient triangle is drawn for the time period between 5 and 10 seconds below:
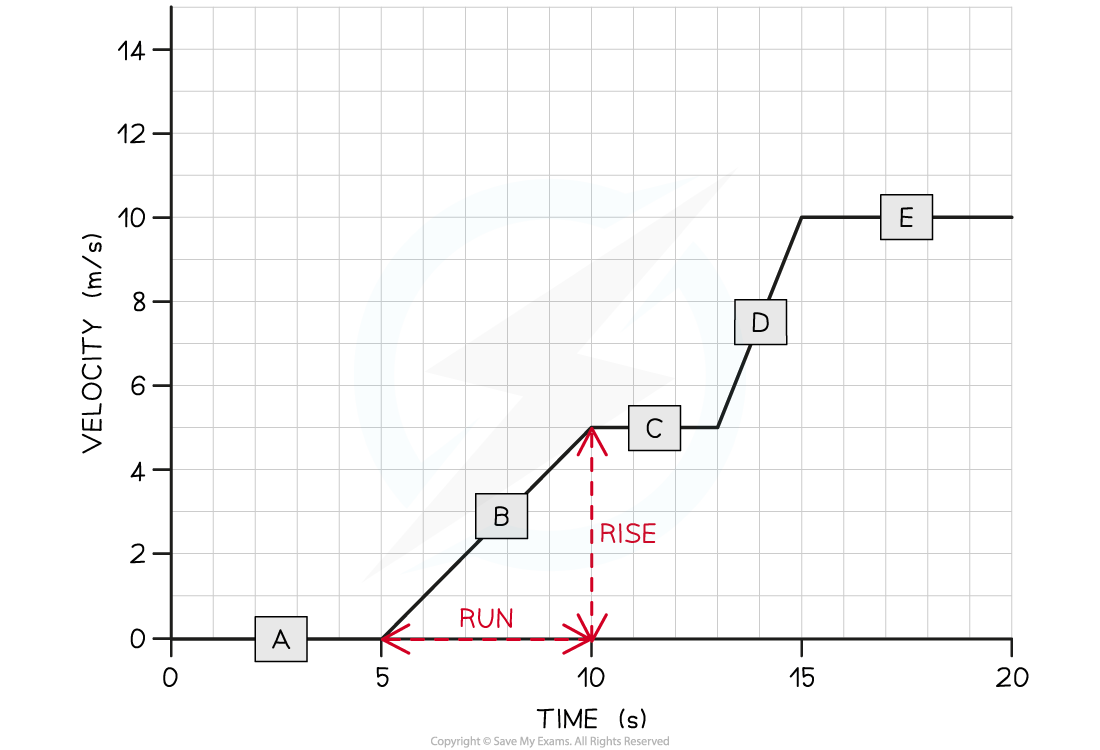
Step 3: Calculate the size of the gradient and state this as the acceleration
-
- The acceleration is given by the gradient, which can be calculated using:
acceleration = gradient = 5 ÷ 5 = 1 m/s2
-
- Therefore, Tora accelerated at 1 m/s2 between 5 and 10 seconds
Exam Tip
Use the entire slope, where possible, to calculate the gradient. Examiners tend to award credit if they see a large gradient triangle used - so remember to draw 'rise' and 'run' lines directly on the graph itself!
转载自savemyexam

早鸟钜惠!翰林2025暑期班课上线

最新发布
© 2025. All Rights Reserved. 沪ICP备2023009024号-1


