IB DP Maths: AA SL复习笔记2.3.3 Graphing Functions

Graphing Functions
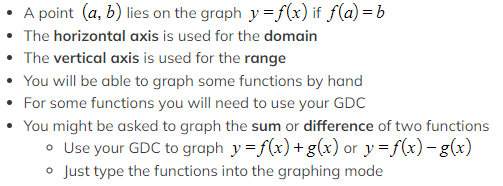
How do I graph the function y = f(x)?
 What is the difference between “draw” and “sketch”?
- If asked to sketch you should:
- Show the general shape
- Label any key points such as the intersections with the axes
- Label the axes
- If asked to draw you should:
- Use a pencil and ruler
- Draw to scale
- Plot any points accurately
- Join points with a straight line or smooth curve
- Label any key points such as the intersections with the axes
- Label the axes
How can my GDC help me sketch/draw a graph?
- You use your GDC to plot the graph
- Check the scales on the graph to make sure you see the full shape
- Use your GDC to find any key points
- Use your GDC to check specific points to help you plot the graph
Key Features of Graphs
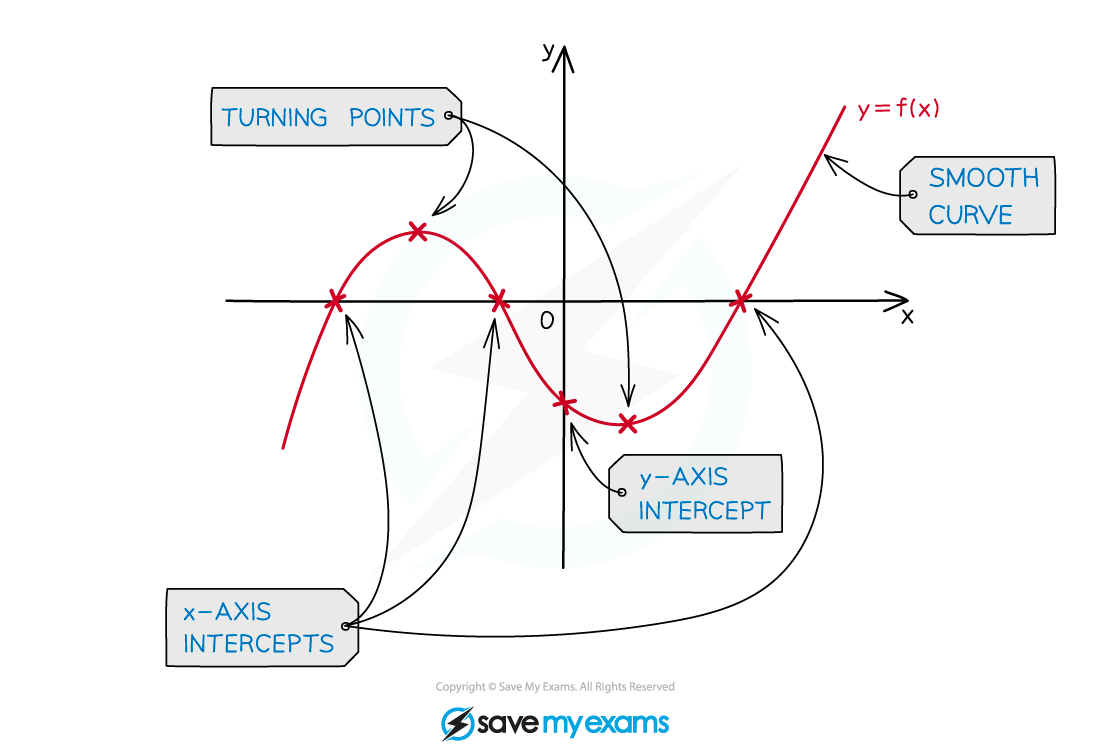
What are the key features of graphs?
- You should be familiar with the following key features and know how to use your GDC to find them
- Local minimums/maximums
- These are points where the graph has a minimum/maximum for a small region
- They are also called turning points
- A graph can have multiple local minimums/maximums
- A local minimum/maximum is not necessarily the minimum/maximum of the whole graph
- This would be called the global minimum/maximum
- For quadratic graphs the minimum/maximum is called the vertex
- Intercepts
- y – intercepts are where the graph crosses the y-axis
- At these points x = 0
- x – intercepts are where the graph crosses the x-axis
- At these points y = 0
- These points are also called the zeros of the function or roots of the equation
- y – intercepts are where the graph crosses the y-axis
- Symmetry
- Some graphs have lines of symmetry
- A quadratic will have a vertical line of symmetry
- Some graphs have lines of symmetry
- Asymptotes
- These are lines which the graph will get closer to but not cross
- These can be horizontal or vertical
- Exponential graphs have horizontal asymptotes
- Graphs of variables which vary inversely can have vertical and horizontal asymptotes
Exam Tip
- Most GDC makes/models will not plot/show asymptotes just from inputting a function
- Add the asymptotes as additional graphs for your GDC to plot
- You can then check the equations of your asymptotes visually
- You may have to zoom in or change the viewing window options to confirm an asymptote
- Even if using your GDC to plot graphs and solve problems sketching them as part of your working is good exam technique
- Label the key features of the graph and anything else relevant to the question on your sketch
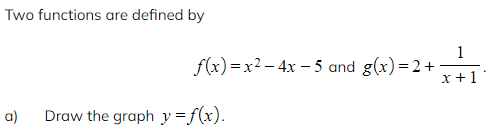
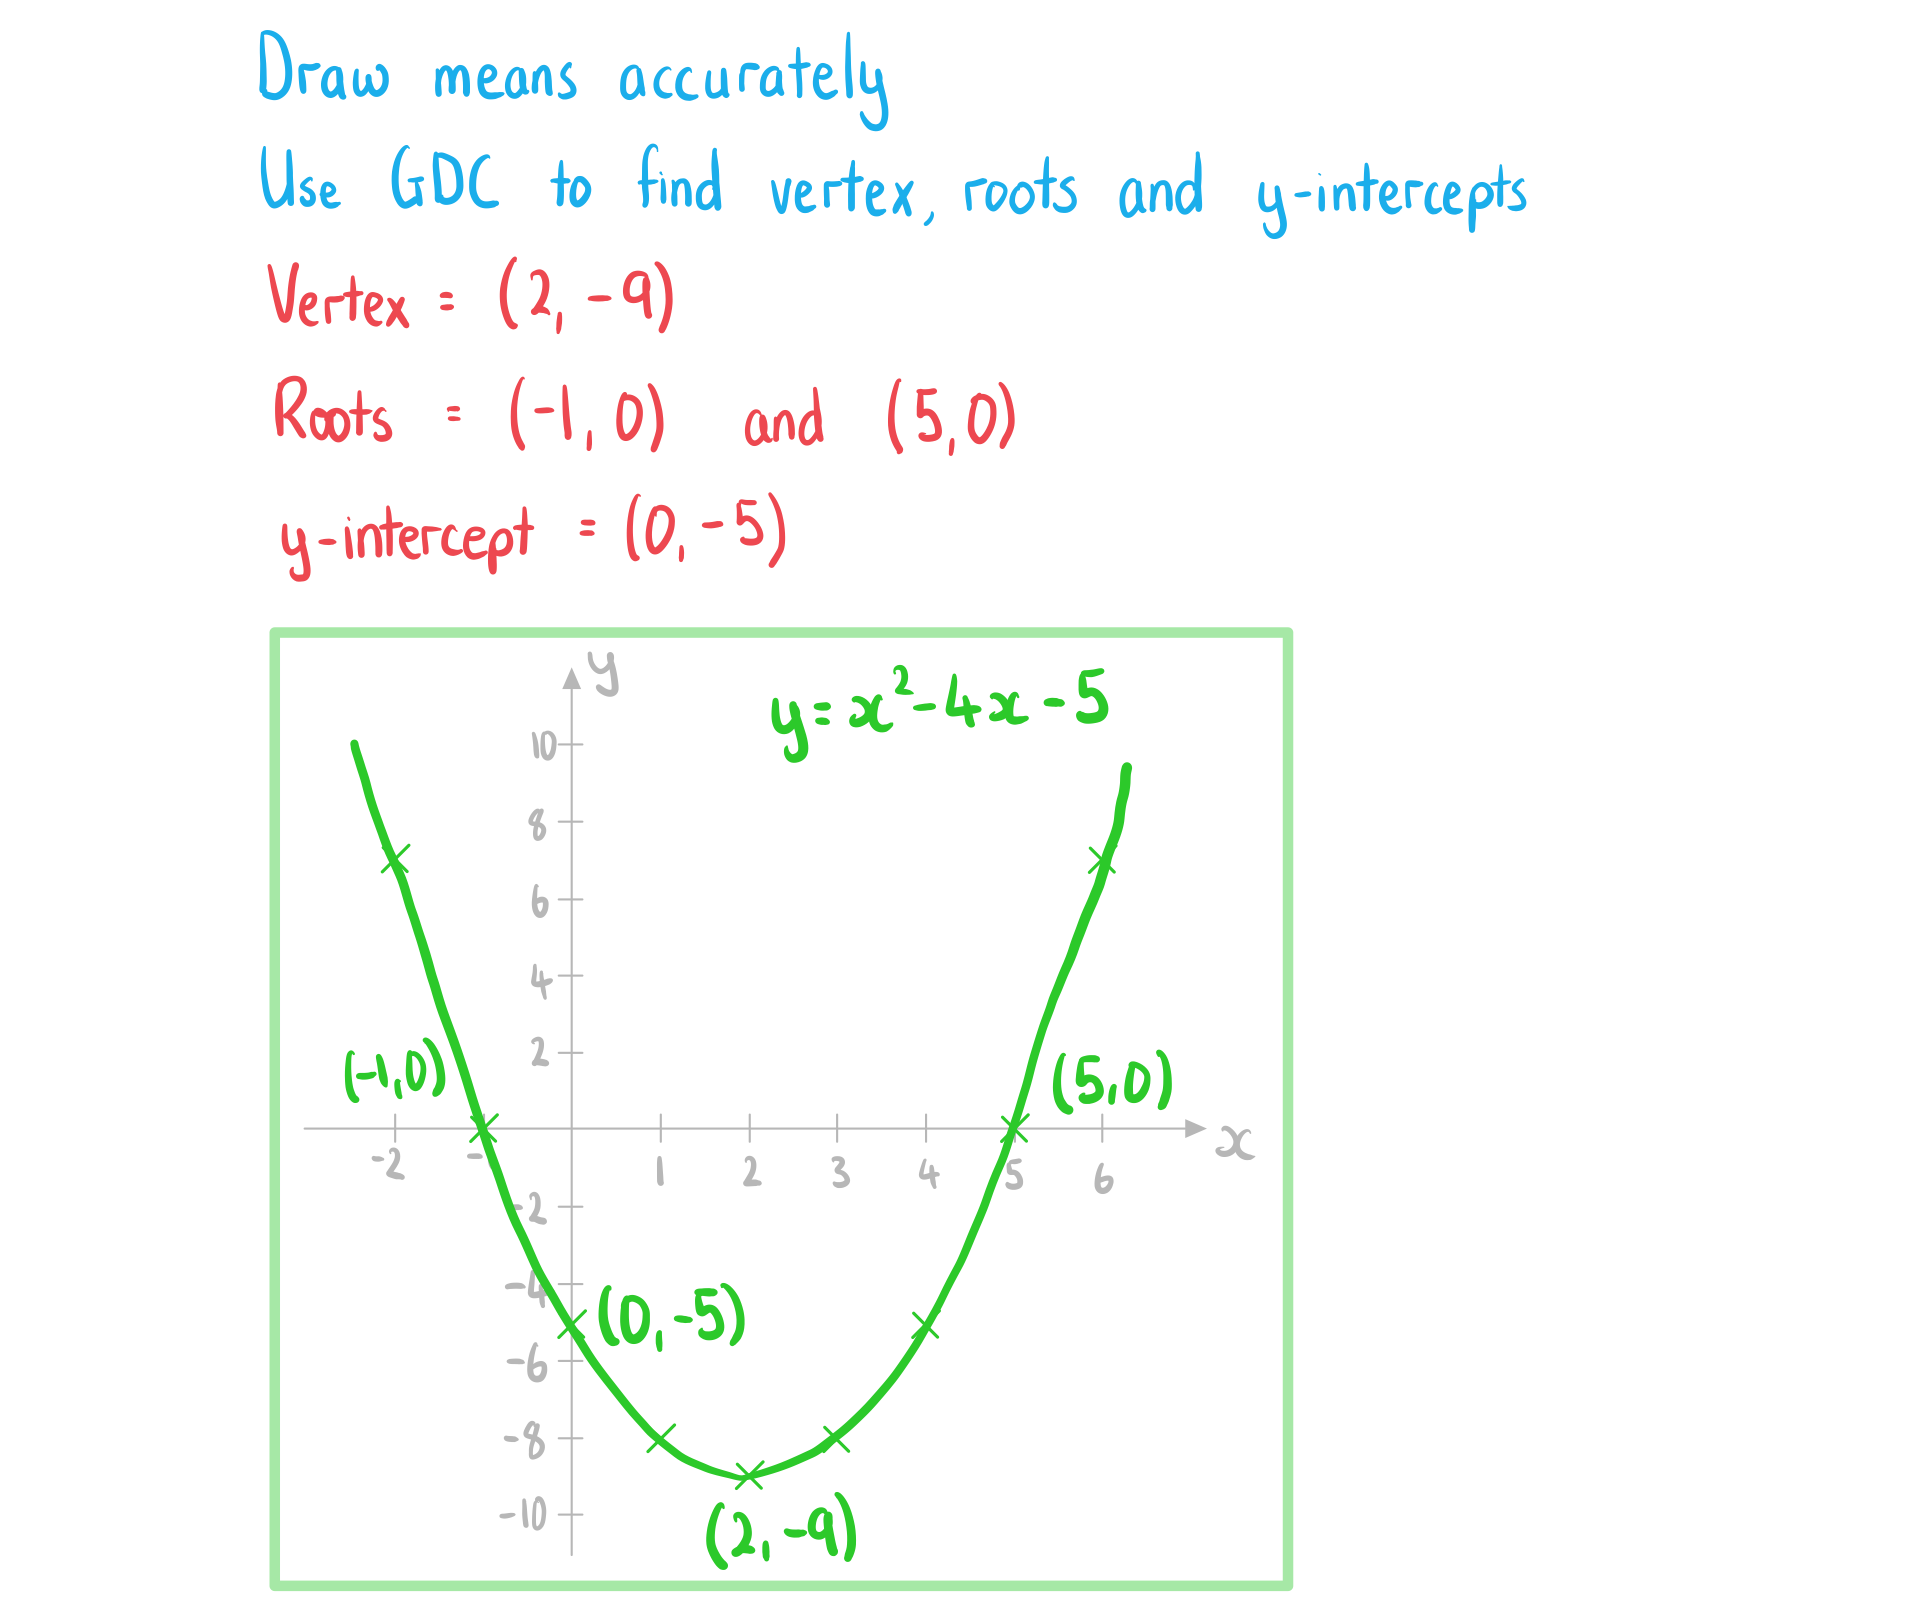
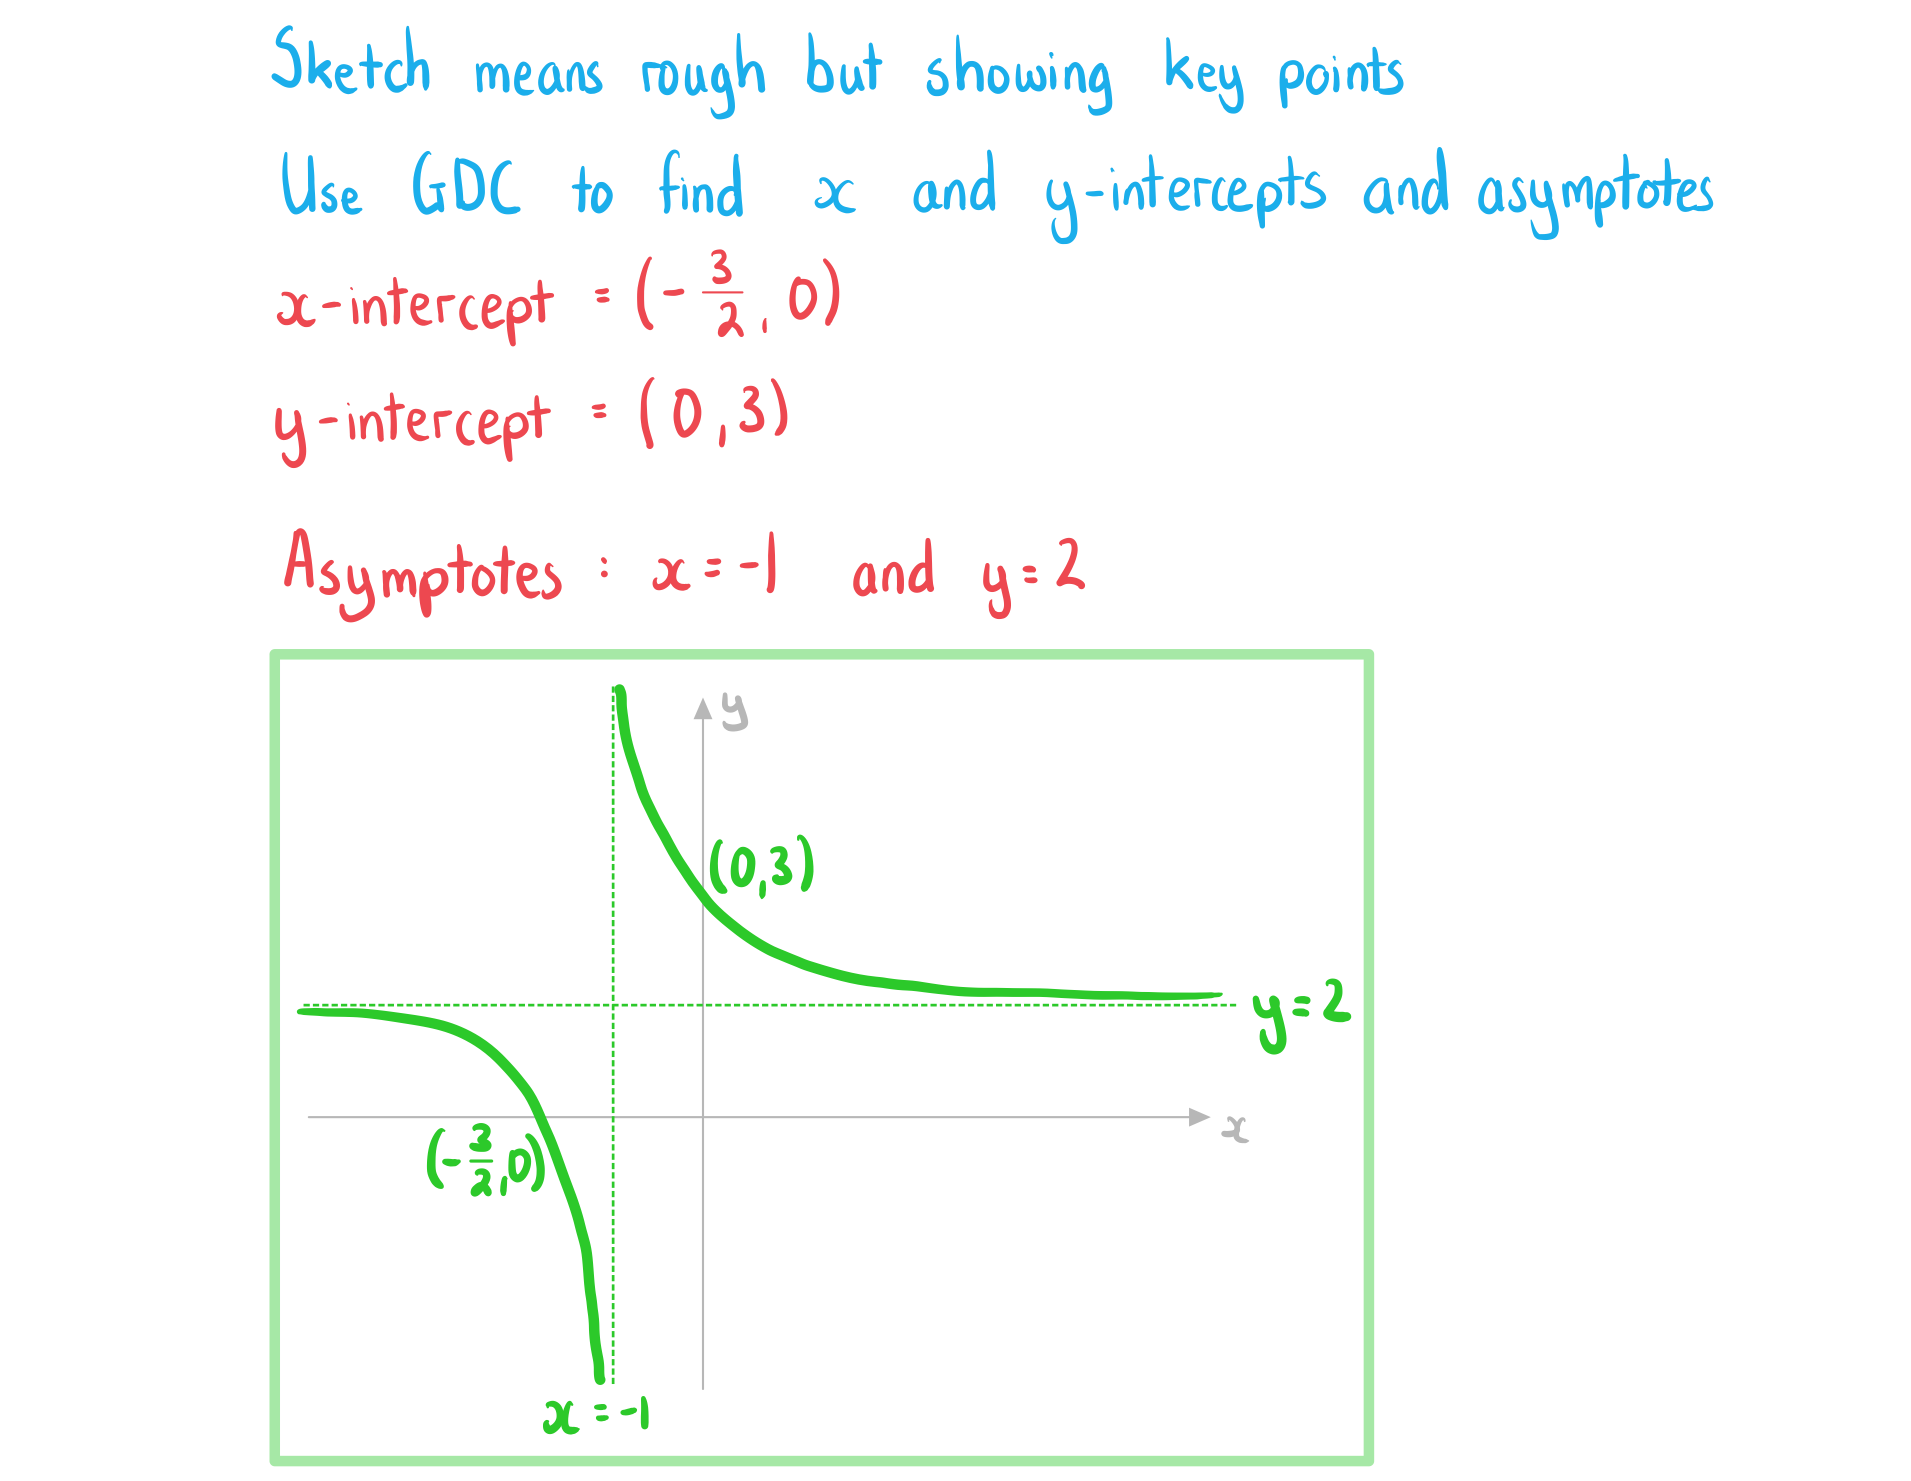
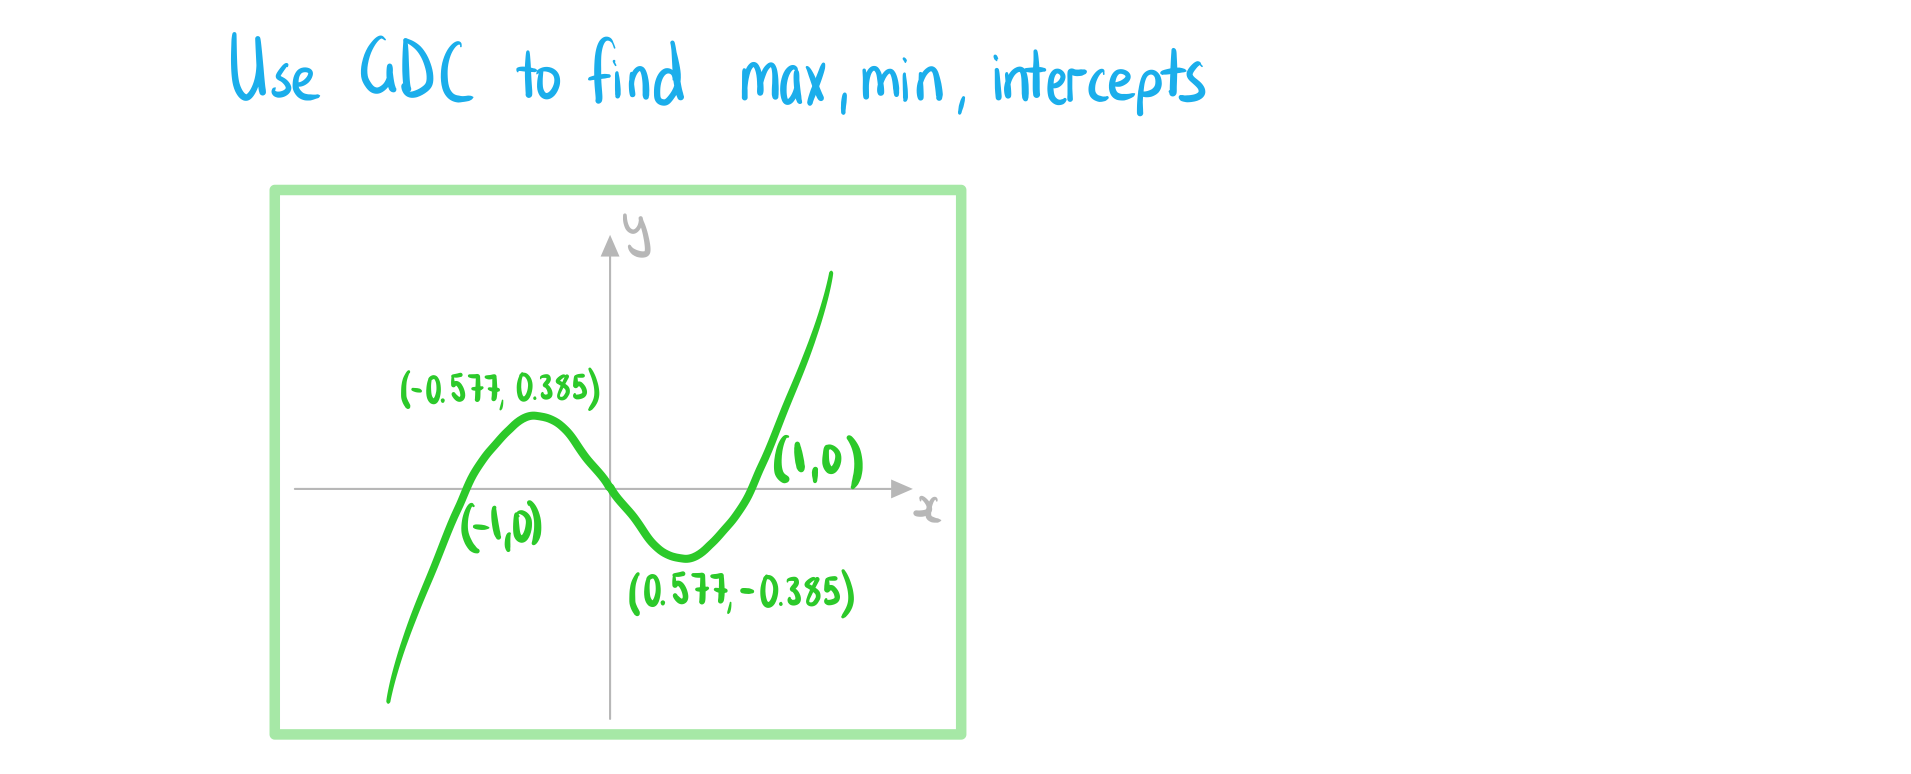
Worked Example
![]()
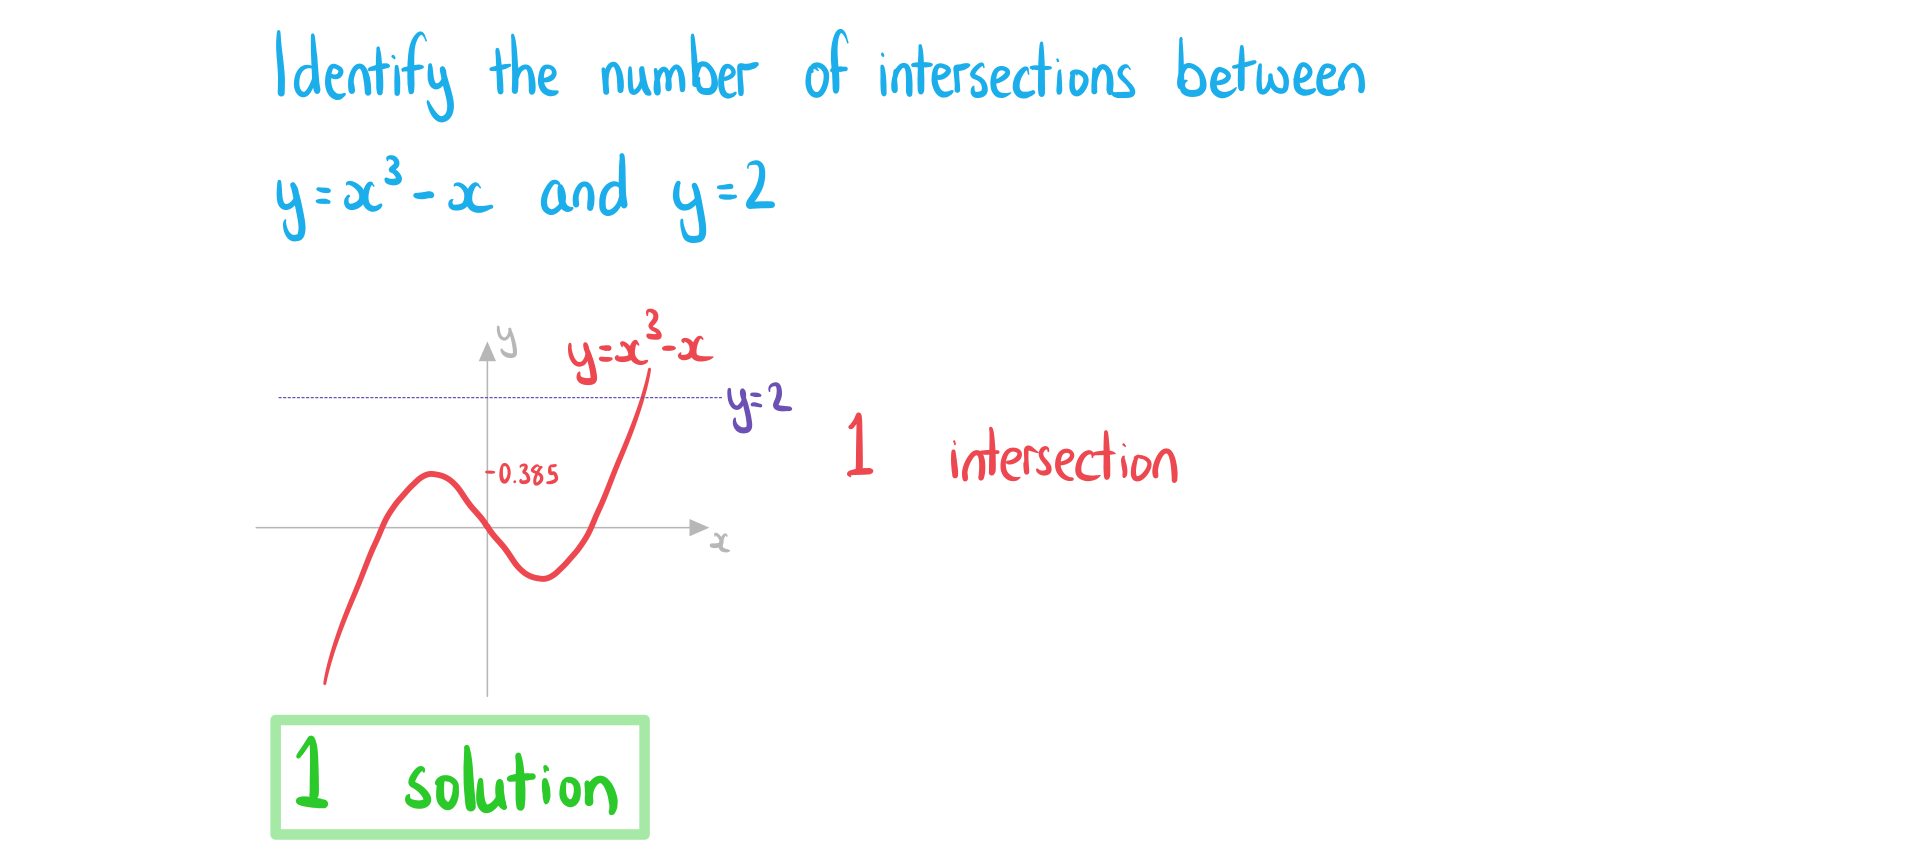
![]()
Intersecting Graphs
How do I find where two graphs intersect?
- Plot both graphs on your GDC
- Use the intersect function to find the intersections
- Check if there is more than one point of intersection
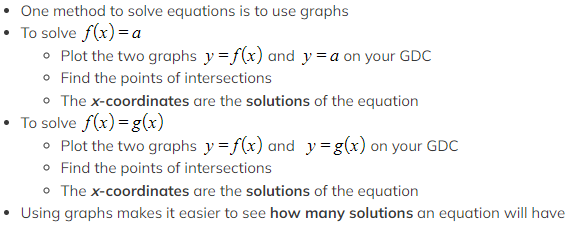
How can I use graphs to solve equations?
 Exam Tip
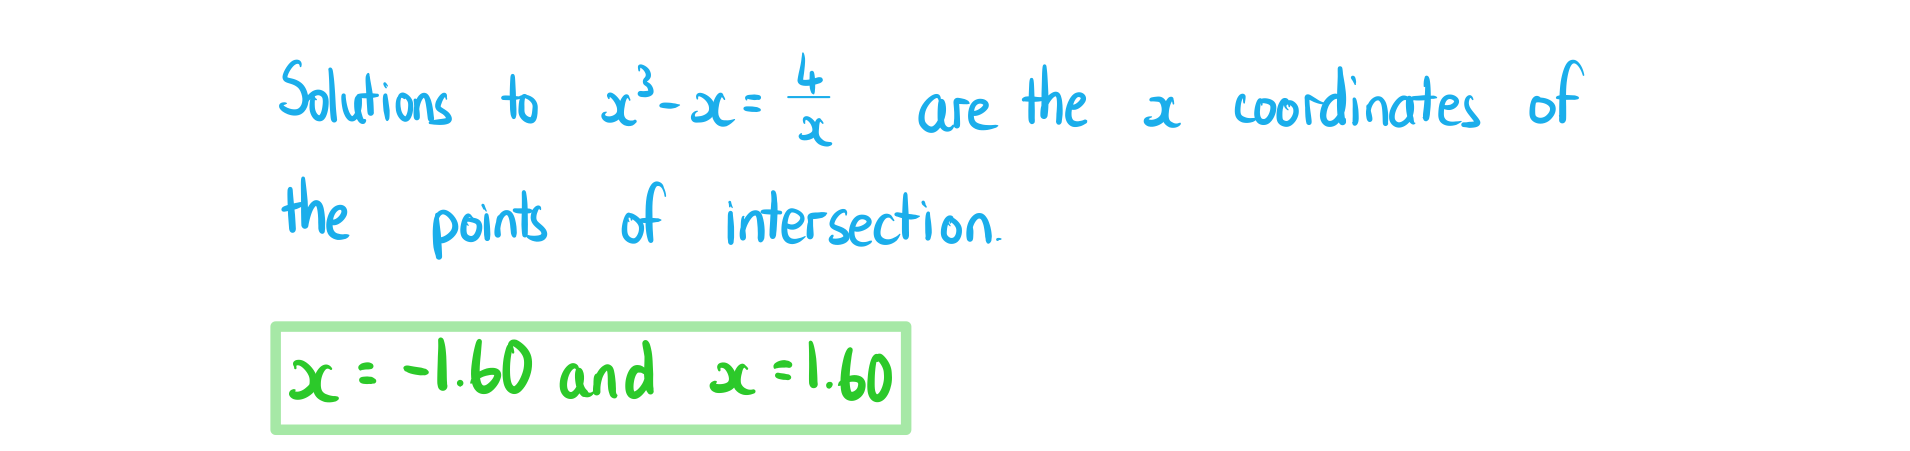
- You can use graphs to solve equations
- Questions will not necessarily ask for a drawing/sketch or make reference to graphs
- Use your GDC to plot the equations and find the intersections between the graphs
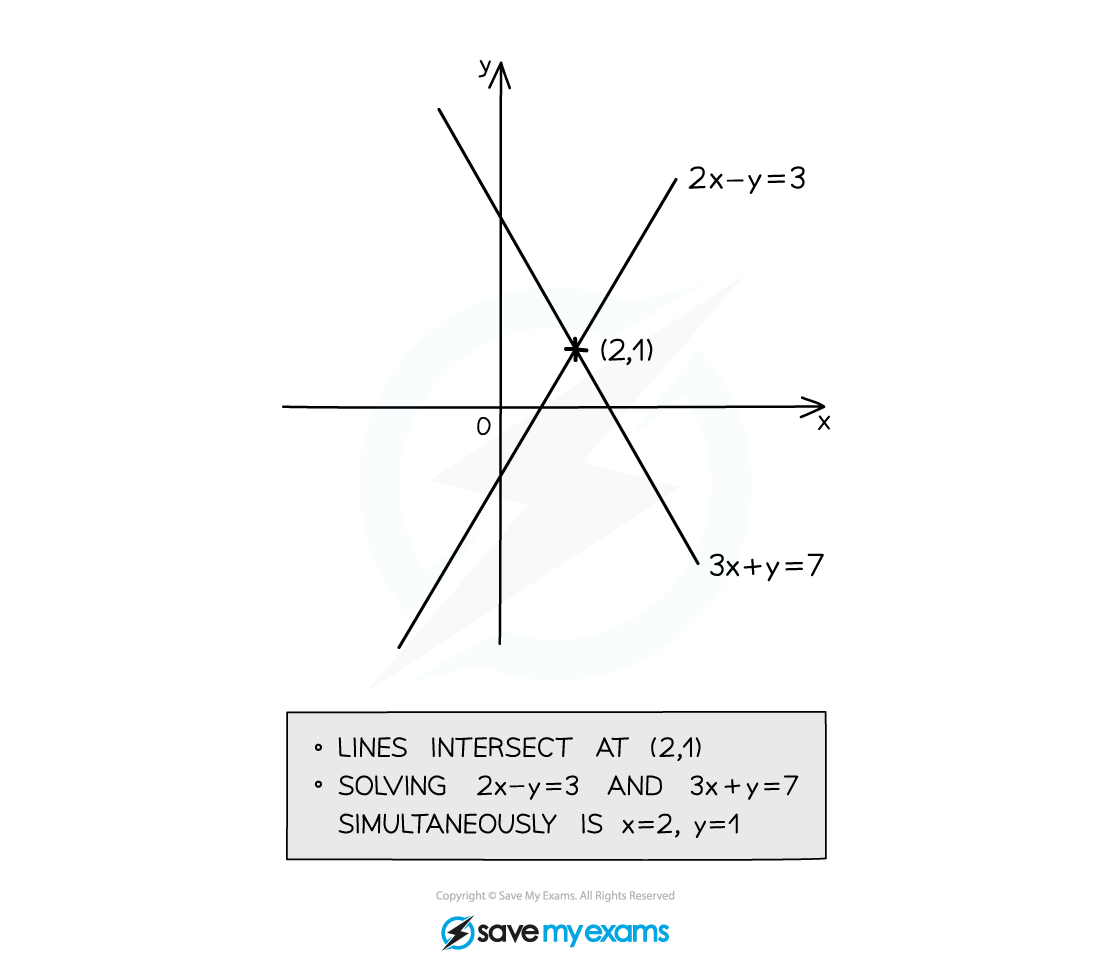
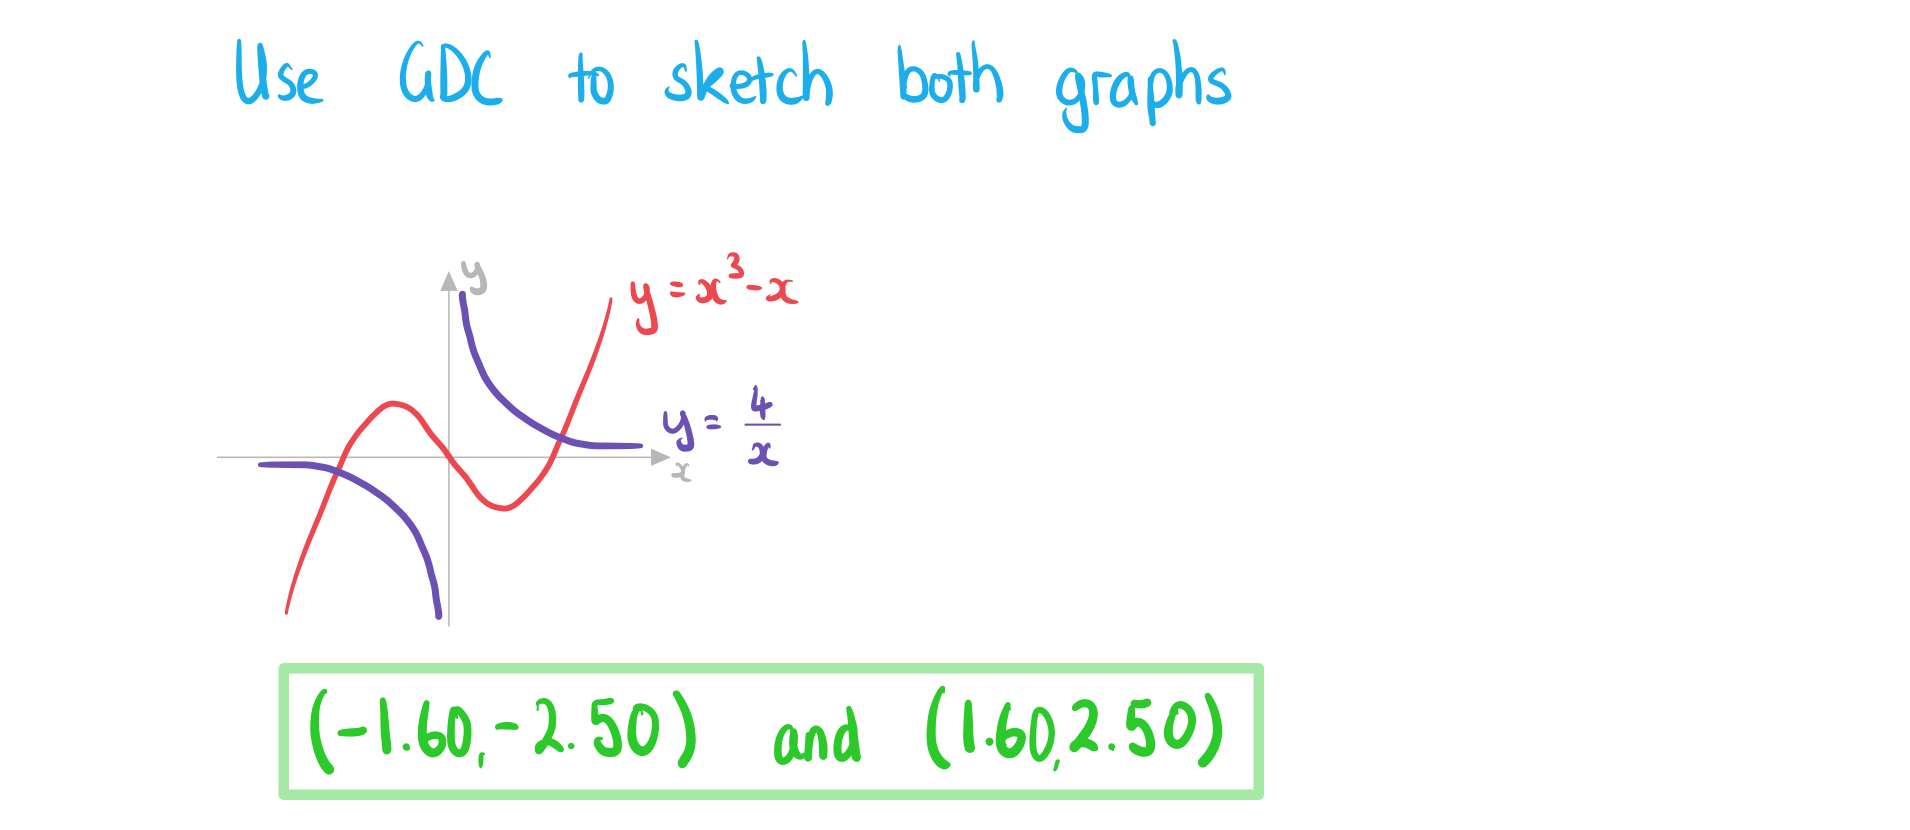
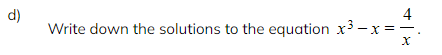
Worked Example
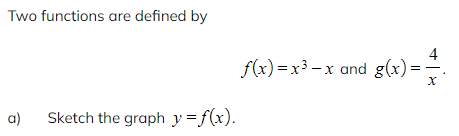
![]()
![]()
转载自savemyexams

国际竞赛真题资料-点击免费领取!

早鸟钜惠!翰林2025暑期班课上线

美高学分项目重磅来袭!立即了解