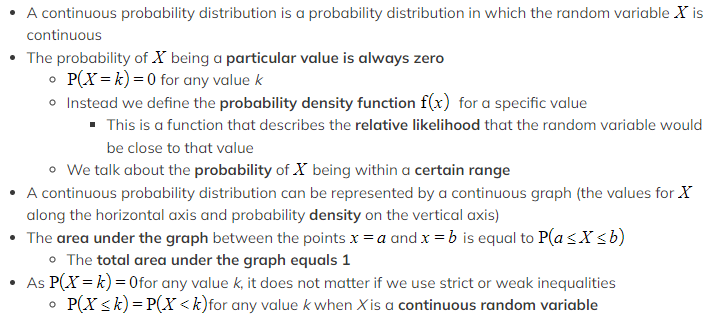
What is a continuous random variable?
- A continuous random variable (often abbreviated to CRV) is a random variable that can take any value within a range of infinite values
- Continuous random variables usually measure something
- For example, height, weight, time, etc
What is a continuous probability distribution?
 What is a normal distribution?
- A normal distribution is a continuous probability distribution
-
 μ is the mean
- σ2 is the variance
- σ is the standard deviation
- If the mean changes then the graph is translated horizontally
- If the variance changes then the graph is stretched horizontally
- A small variance leads to a tall curve with a narrow centre
- A large variance leads to a short curve with a wide centre
What are the important properties of a normal distribution?
- The mean is μ
- The variance is σ2
- If you need the standard deviation remember to square root this
- The normal distribution is symmetrical about
- Mean = Median = Mode = μ
- There are the results:
- Approximately two-thirds (68%) of the data lies within one standard deviation of the mean (μ ± σ)
- Approximately 95% of the data lies within two standard deviations of the mean (μ ±2σ)
- Nearly all of the data (99.7%) lies within three standard deviations of the mean (μ ±3σ)
Modelling with Normal Distribution
What can be modelled using a normal distribution?
- A lot of real-life continuous variables can be modelled by a normal distribution provided that the population is large enough and that the variable is symmetrical with one mode

- This fact allows us to model variables that are not defined for all real values such as height and weight
What can not be modelled using a normal distribution?
- Variables which have more than one mode or no mode
- For example: the number given by a random number generator
- Variables which are not symmetrical
- For example: how long a human lives for
Exam Tip
- An exam question might involve different types of distributions so make it clear which distribution is being used for each variable
Worked Example
 a) Write down the mean and standard deviation of the running speeds of cheetahs.
b) State two assumptions that have been made in order to use this model.


