- 翰林提供学术活动、国际课程、科研项目一站式留学背景提升服务!
- 400 888 0080
AQA A Level Physics复习笔记7.10.1 Alternating Current & Voltage
Sinusoidal & Root-Mean-Square Current & Voltage
- An alternating current (a.c) is defined as:
A current which periodically varies between a positive to a negative value with time
- This means the direction of an alternating current varies every half cycle
- The variation of current, or p.d., with time can be described as a sine curve ie. sinusoidal
- Therefore, the electrons in a wire carrying a.c. move back and forth with simple harmonic motion
- As with SHM, the relationship between time period T and frequency f for a.c is:

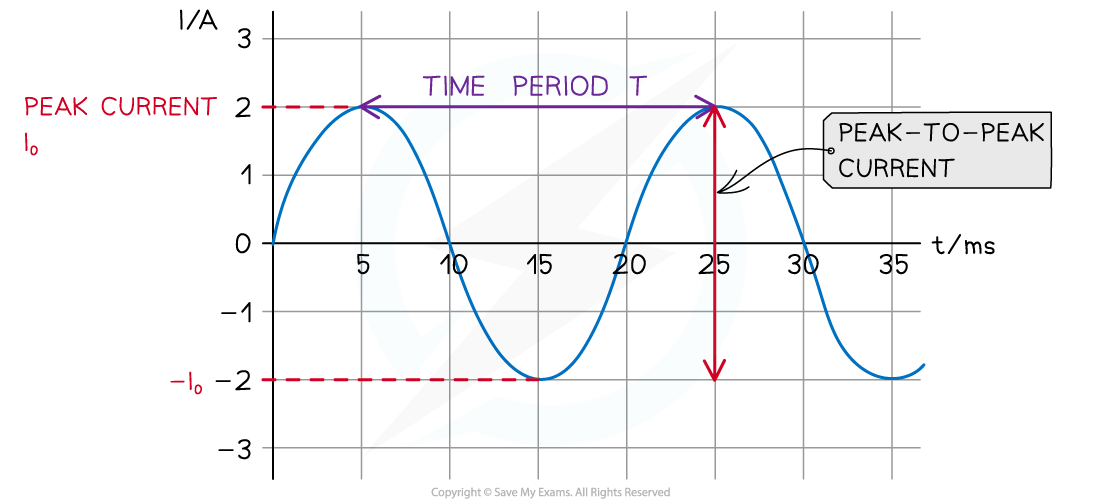
- Peak current (I0), or peak voltage (V0), is defined as:
The maximum value of the alternating current or voltage
- Peak current, or voltage, can be determined from the amplitude of a current-time or voltage-time graph
- The peak-to-peak current or voltage is the distance between a positive and consecutive negative peak. This means:
peak voltage V0 = peak-to-peak voltage ÷ 2

Graph of alternating current against time showing the time period, peak current and peak-to-peak current
Worked Example
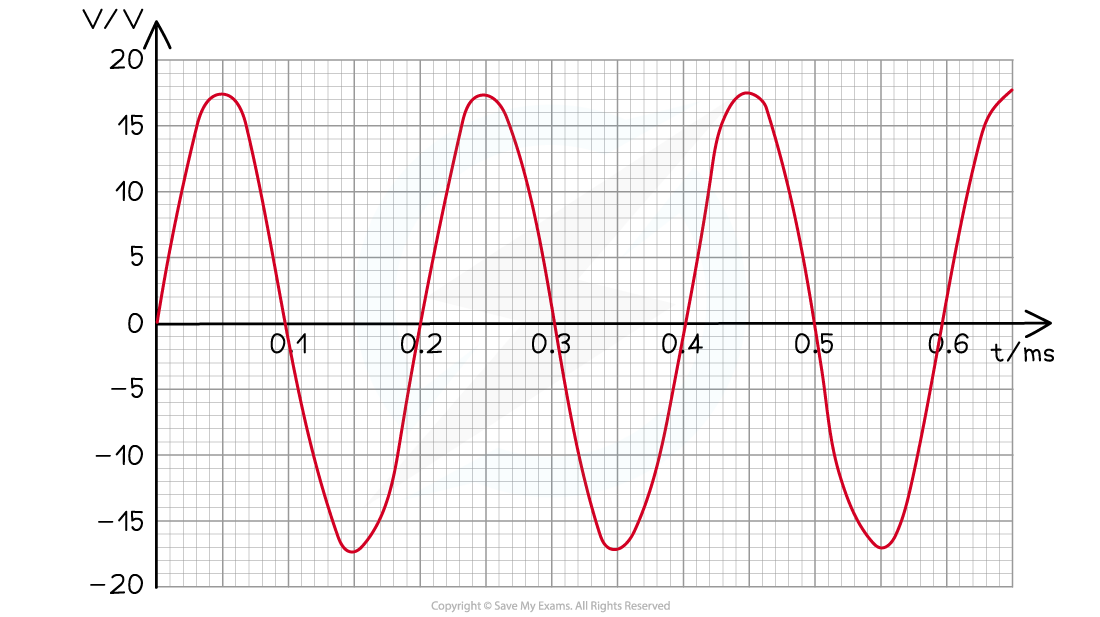
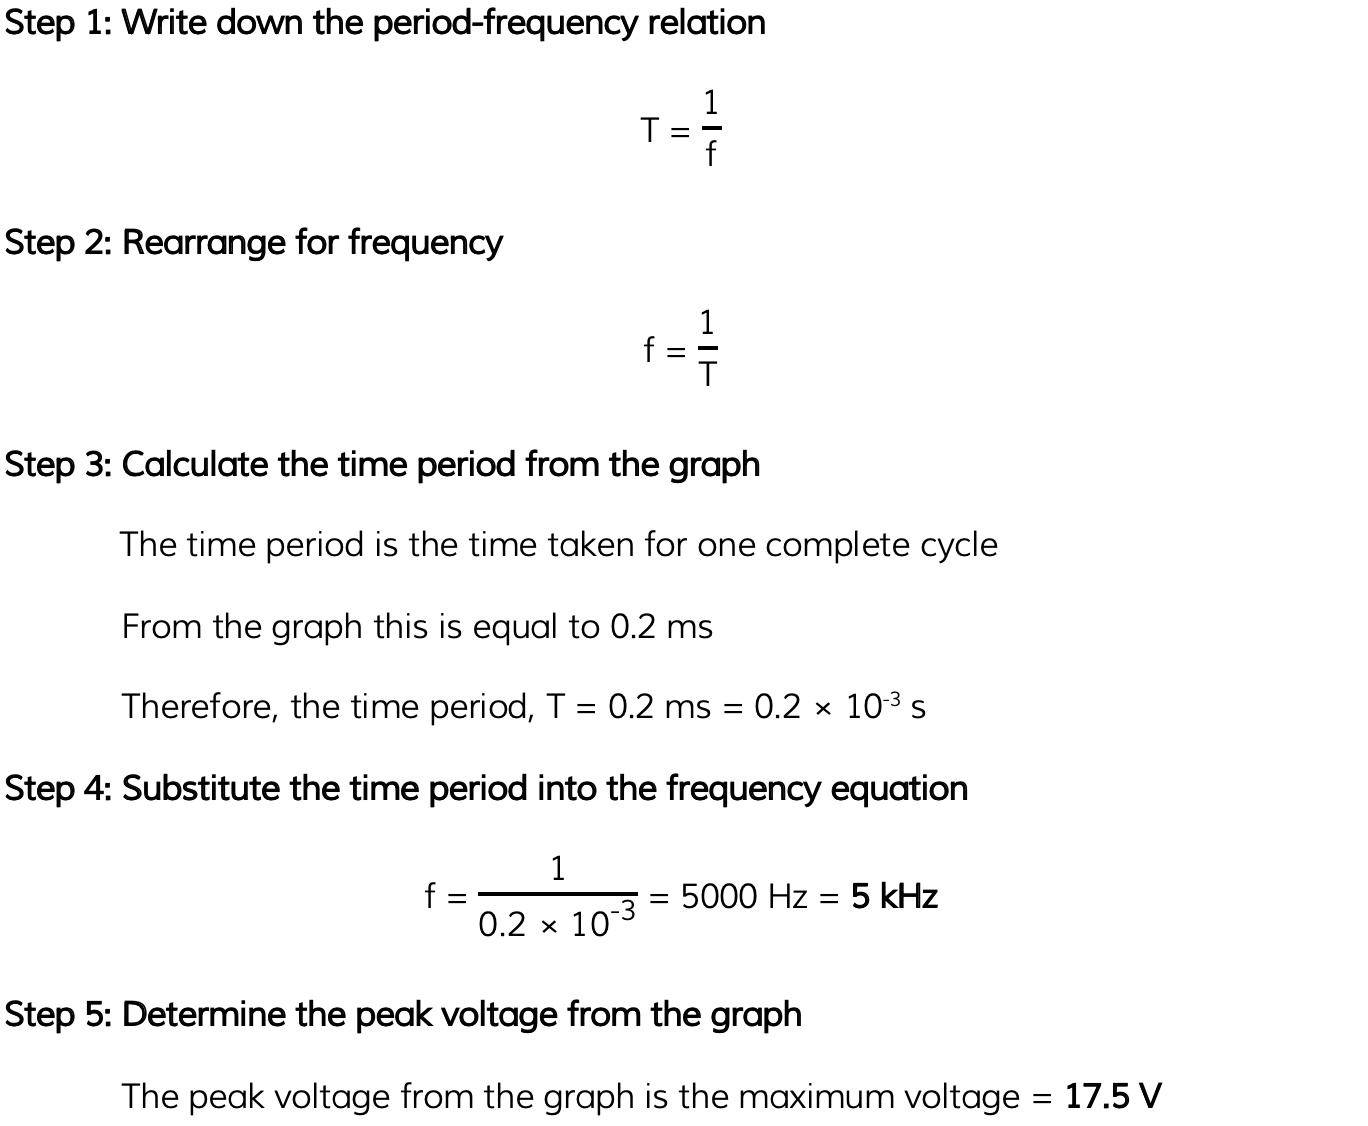
The variation with time t of the output voltage V of an alternating voltage supply is shown in the graph below. Use the graph to calculate the frequency of the supply and the peak voltage.

Root-Mean-Square Current & Voltage
- Root-mean-square (rms) values of current, or voltage, are a useful way of comparing a.c current, or voltage, to its equivalent direct current (d.c), or voltage
- The rms values represent the direct current, or voltage, values that will produce the same heating effect, or power dissipation, as the alternating current, or voltage
- The rms value of an alternating current is defined as:
The square root of the mean of the squares of all the values of the current in one cycle
- Or:
The equivalent direct current that produces the same power
- The rms current Irms is defined by the equation:

- Where:
- I0 = peak current (A)
- The rms value of an alternating voltage is defined as:
The square root of the mean of the squares of all the values of the voltage in one cycle
- Or:
The equivalent dc voltage that produces the same power
- The rms voltage Vrms is defined by the equation:

- Where:
- V0 = peak voltage (V)
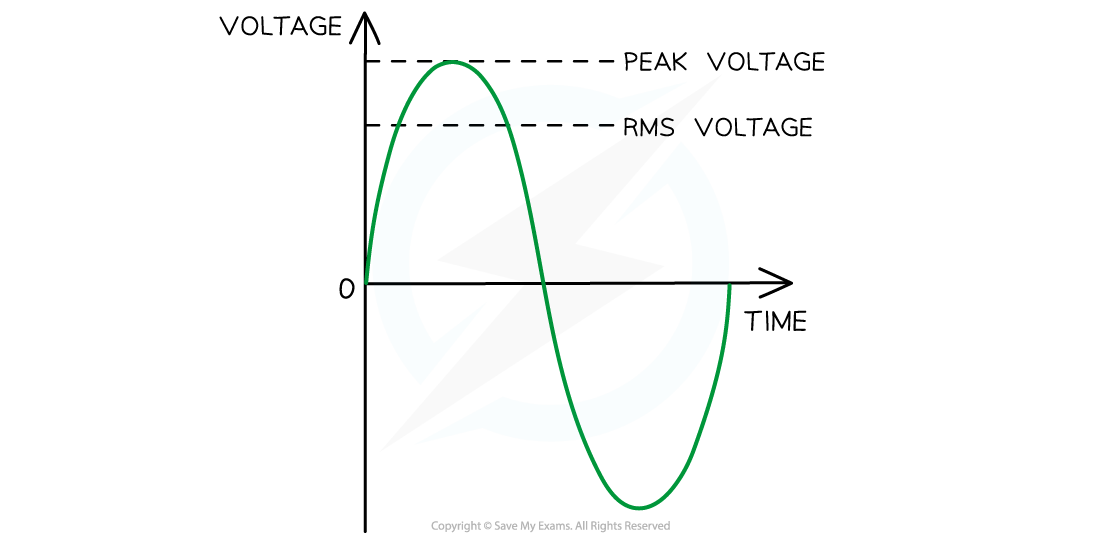
- Rms current is equal to 0.707 × I0, which is about 70% of the peak current I0
- This is also the case for rms voltage
- The rms value is therefore defined as:
The steady direct current, or voltage, that delivers the same average power in a resistor as the alternating current, or voltage
- A resistive load is any electrical component with resistance eg. a lamp

Vrms and peak voltage. The rms voltage is about 70% of the peak voltage
- The average power of a supply is the product of the rms current and voltage:
Average power = Irms × Vrms
Worked Example
An electric oven is connected to a 230 V root mean square (rms) mains supply using a cable of negligible resistance.Calculate the peak-to-peak voltage of the mains supply.
Step 1: Write down the Vrms equation

Step 2: Rearrange for the peak voltage, V0
V0 = √2 × Vrms
Step 3: Substitute in the values
V0 = √2 × 230
Step 4: Calculate the peak-to-peak voltage
-
- The peak-to-peak voltage is the peak voltage (V0) × 2
Peak-to-peak voltage = (√2 × 230) × 2 = 650.538 = 651 V (3 s.f)
Exam Tip
Remember to double-check the units on the alternating current and voltage graphs. These are often shown in milliseconds (ms) instead of seconds (s) on the x-axis.
Applications of Alternating Current & Voltage
- Mains electricity is supplied as alternating current by the National Grid
- This means that power stations produce alternating current
- This is the type of current supplied when devices are plugged into sockets
- In the UK, the mains electricity supplied to households is 230 V at 50 Hz. This is its rms value
- However, this varies depending on the customer (larger buildings and factories will require more)
- The mains voltage varies throughout the day depending on the demand and supply of electricity
- It is only lamps, heaters, cookers and devices with large electric motors (such as vacuum cleaners) that use a.c from the mains
- Most other devices such as televisions, computers and games consoles work with d.c
- This means they are built with a step-down transformer that converts the 230 V a.c into (for example) 12 V d.c
- The peak and peak-to-peak values for the current and voltage for mains electricity are used to calculate the rms value and vice versa
转载自savemyexams

最新发布
© 2025. All Rights Reserved. 沪ICP备2023009024号-1


