- 翰林提供学术活动、国际课程、科研项目一站式留学背景提升服务!
- 400 888 0080
IB DP Maths: AA HL复习笔记3.5.2 Transformations of Trigonometric Functions
Transformations of Trigonometric Functions
What transformations of trigonometric functions do I need to know?
- As with other graphs of functions, trigonometric graphs can be transformed through translations, stretches and reflections
- Translations can be either horizontal (parallel to the x-axis) or vertical (parallel to the y-axis)
- For the function y = sin (x)
- A vertical translation of a units in the positive direction (up) is denoted by
y = sin (x) + a - A vertical translation of a units in the negative direction (down) is denoted by
y = sin (x) - a - A horizontal translation in the positive direction (right) is denoted by y = sin (x - a)
- A vertical translation of a units in the positive direction (up) is denoted by
- For the function y = sin (x)
 Stretches can be either horizontal (parallel to the x-axis) or vertical (parallel to the y-axis)
- For the function y = sin (x)
- A vertical stretch of a factor a units is denoted by y = a sin (x)
- For the function y = sin (x)
 Reflections can be either across the x-axis or across the y-axis
- For the function y = sin (x)
- A reflection across the x-axis is denoted by y = - sin (x)
- A reflection across the y-axis is denoted by y = sin (-x)
- For the function y = sin (x)
What combined transformations are there?
- Stretches in the horizontal and vertical direction are often combined
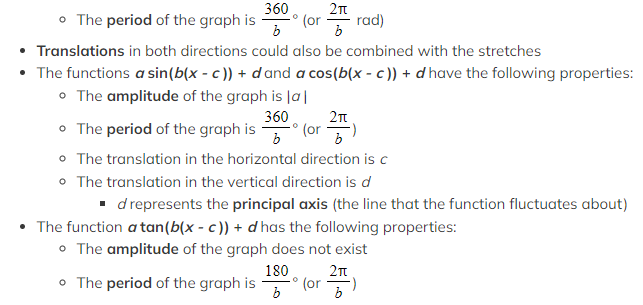
- The functions a sin(bx) and a cos(bx) have the following properties:
- The amplitude of the graph is |a |
-
 The translation in the horizontal direction is c
- The translation in the vertical direction (principal axis) is d
How do I sketch transformations of trigonometric functions?
- Sketch the graph of the original function first
- Carry out each transformation separately
- The order in which you carry out the transformations is important
- Given the form y = a sin(b(x - c )) + d carry out any stretches first, translations next and reflections last
- If the function is written in the form y = a sin(bx - bc ) + d factorise out the coefficient of x before carrying out any transformations
- Use a very light pencil to mark where the graph has moved for each transformation
- It is a good idea to mark in the principal axis the lines corresponding to the maximum and minimum points first
- The principal axis will be the line y = d
- The maximum points will be on the line y = d + a
- The minimum points will be on the line y = d - a
- Sketch in the new transformed graph
- Check it is correct by looking at some key points from the exact values
Exam Tip
- Be sure to apply transformations in the correct order – applying them in the wrong order can produce an incorrect transformation
- When you sketch a transformed graph, indicate the new coordinates of any points that are marked on the original graph
- Try to indicate the coordinates of points where the transformed graph intersects the coordinate axes (although if you don't have the equation of the original function this may not be possible)
- If the graph has asymptotes, don't forget to sketch the asymptotes of the transformed graph as well
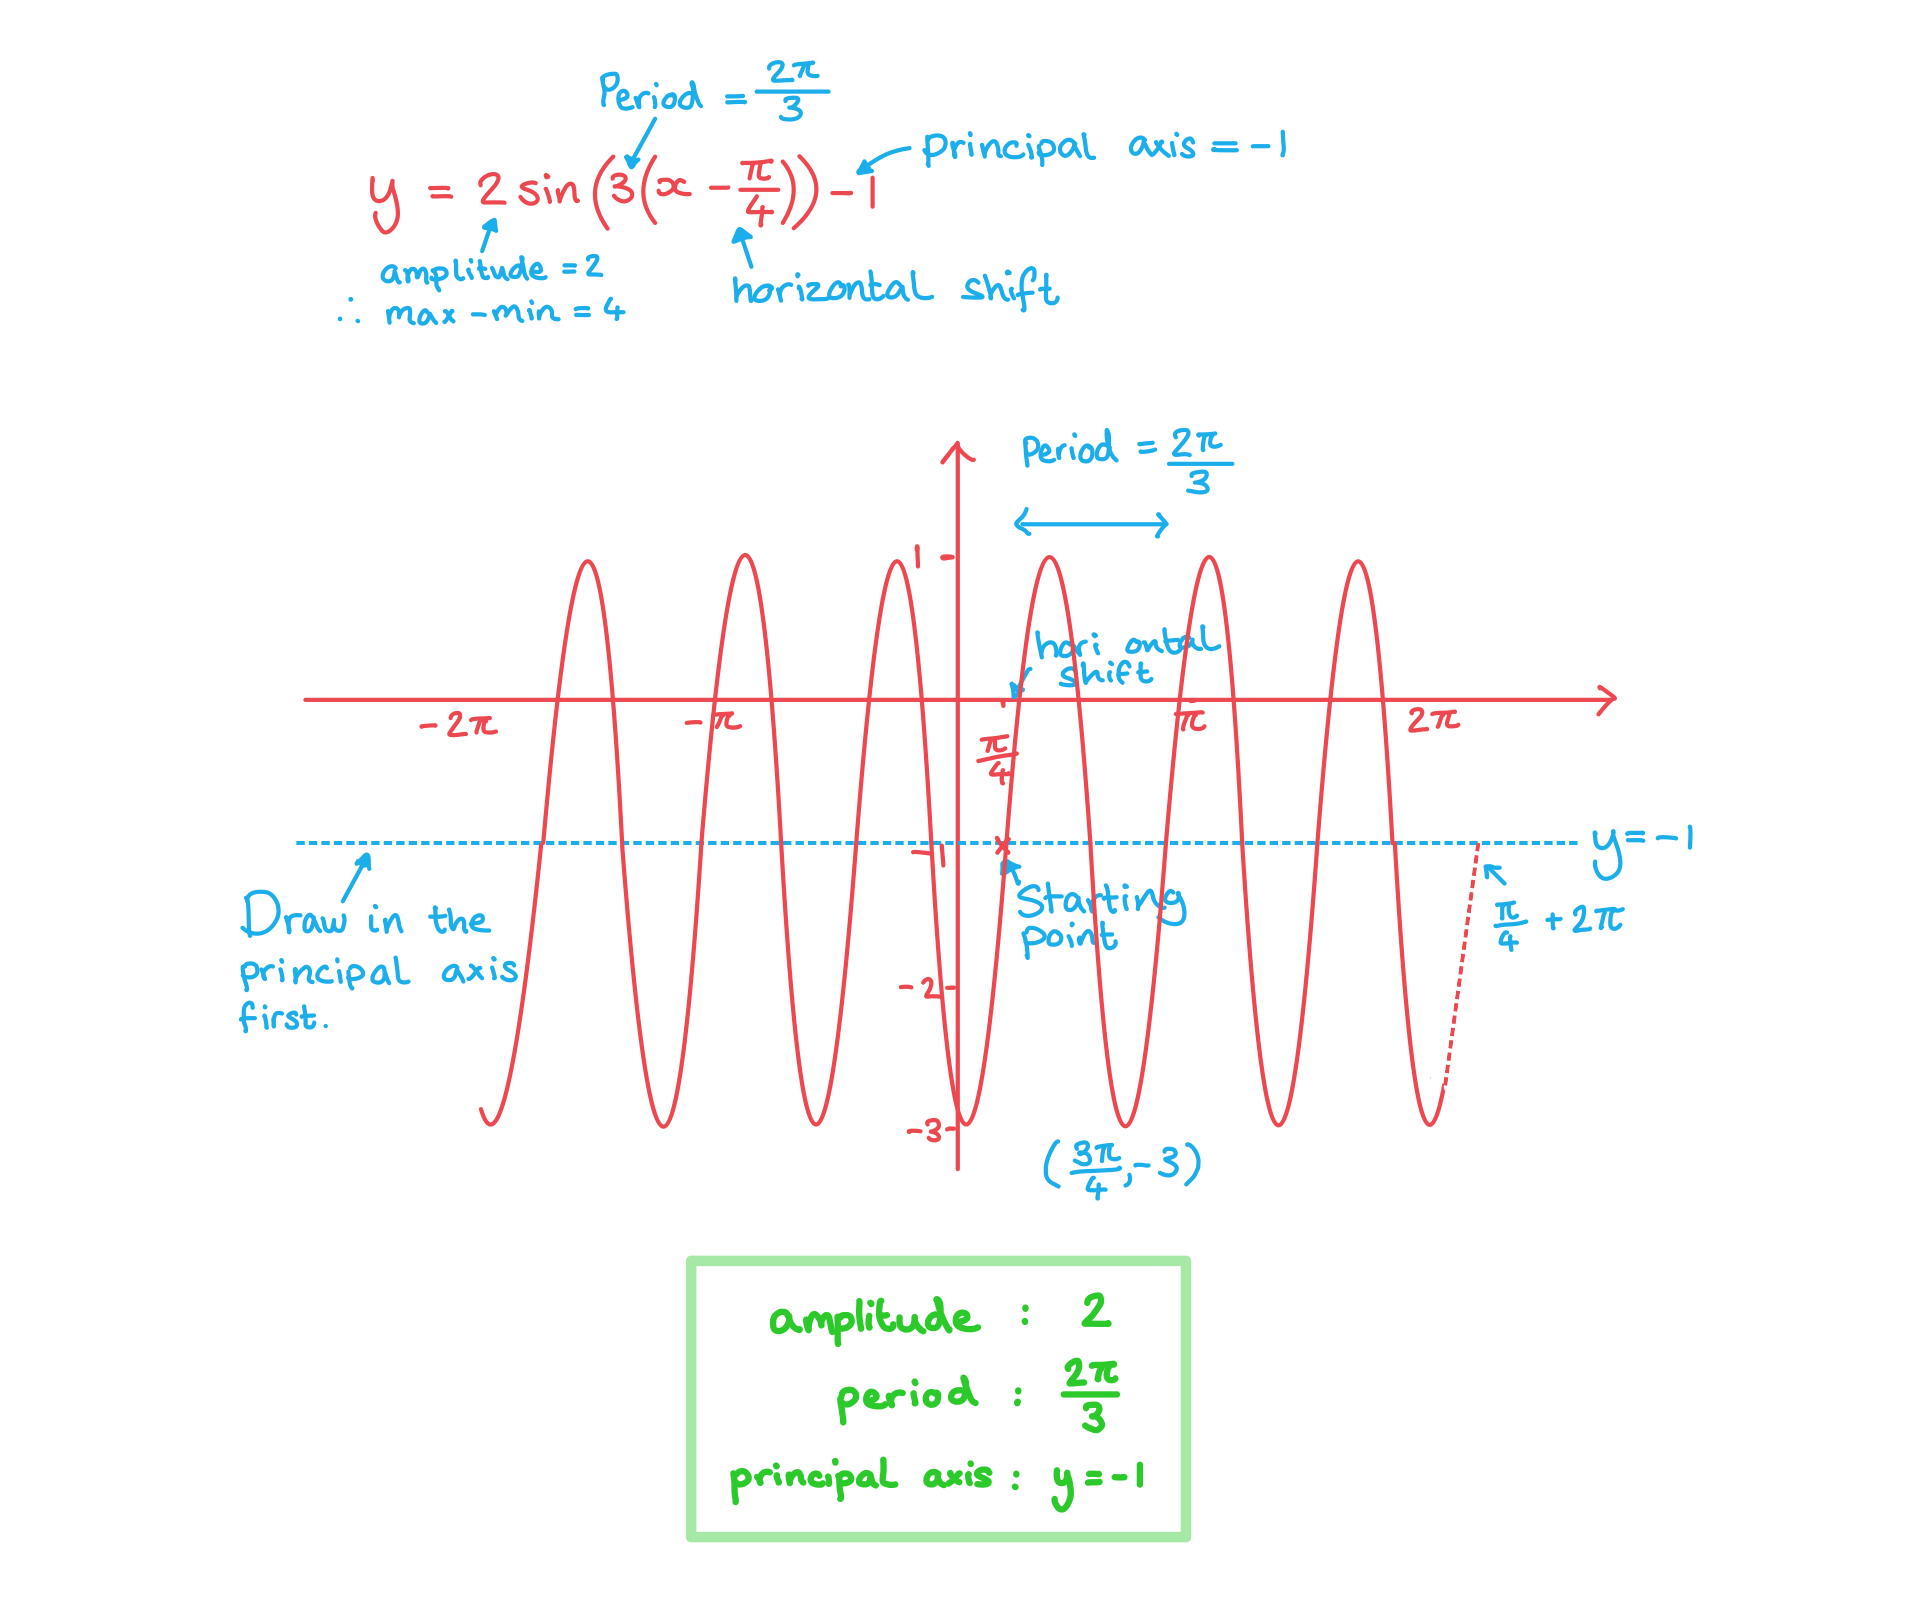
Worked Example


转载自savemyexams

最新发布
© 2025. All Rights Reserved. 沪ICP备2023009024号-1


