AQA A Level Physics复习笔记6.2.2 SHM Graphs

SHM Graphs
- The displacement, velocity and acceleration of an object in simple harmonic motion can be represented by graphs against time
- All undamped SHM graphs are represented by periodic functions
- This means they can all be described by sine and cosine curves
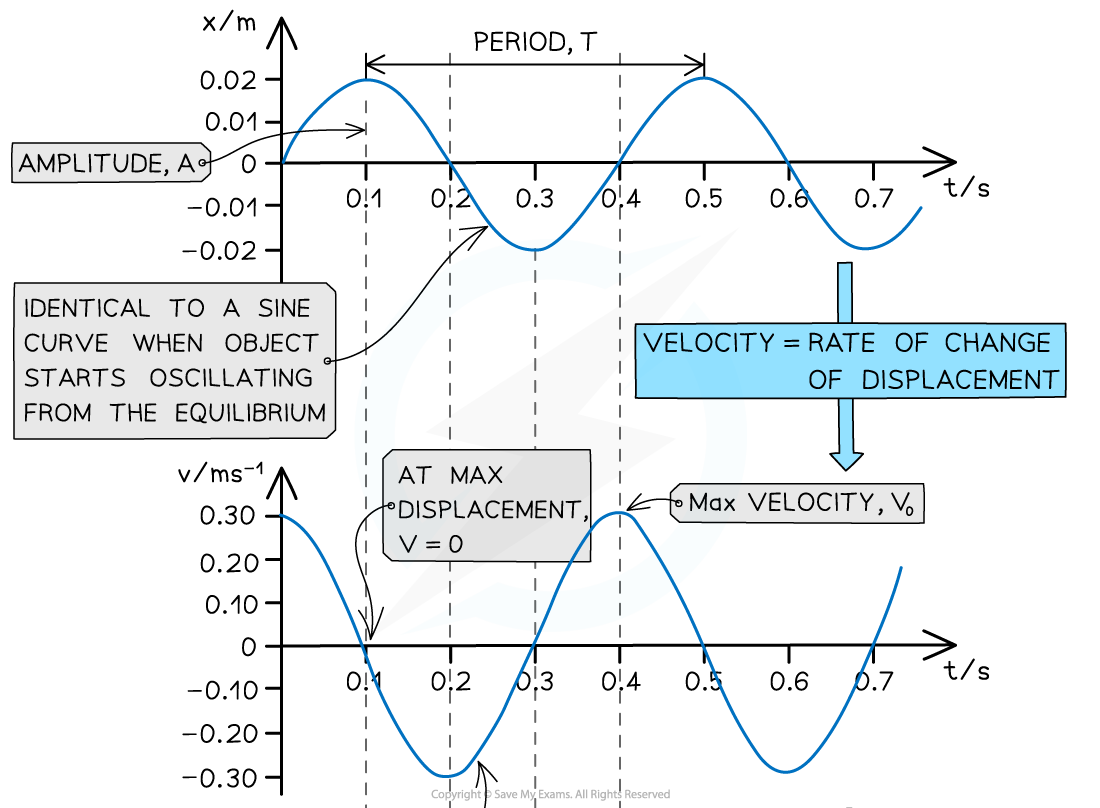
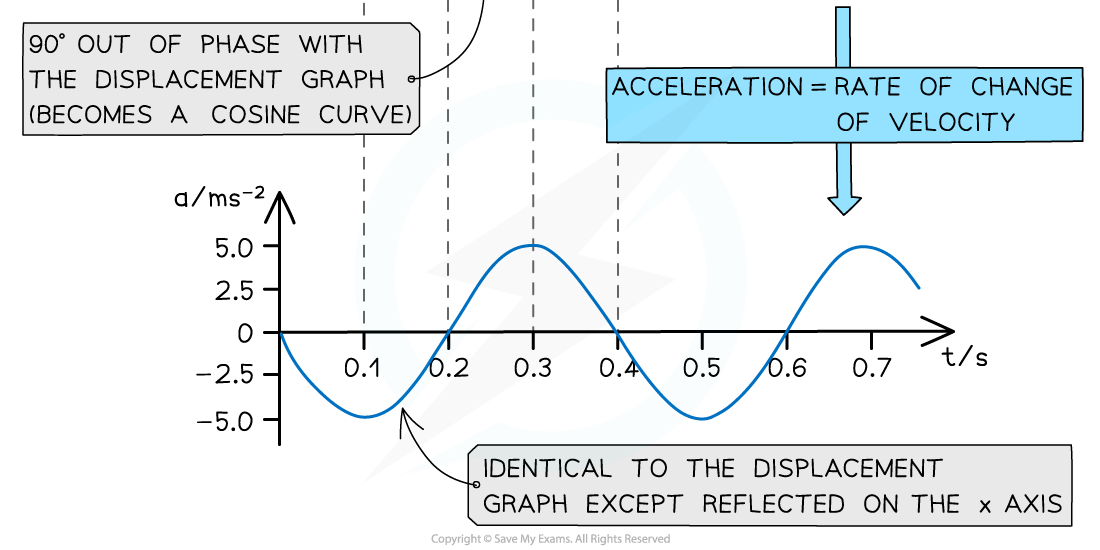
The displacement, velocity and acceleration graphs in SHM are all 90° out of phase with each other
- Key features of the displacement-time graph:
- The amplitude of oscillations A can be found from the maximum value of x
- The time period of oscillations T can be found from reading the time taken for one full cycle
- The graph might not always start at 0
- If the oscillations starts at the positive or negative amplitude, the displacement will be at its maximum
- Key features of the velocity-time graph:
- It is 90o out of phase with the displacement-time graph
- Velocity is equal to the rate of change of displacement
- So, the velocity of an oscillator at any time can be determined from the gradient of the displacement-time graph:

-
- An oscillator moves the fastest at its equilibrium position
- Therefore, the velocity is at its maximum when the displacement is zero
- Key features of the acceleration-time graph:
- The acceleration graph is a reflection of the displacement graph on the x axis
- This means when a mass has positive displacement (to the right) the acceleration is in the opposite direction (to the left) and vice versa
- It is 90° out of phase with the velocity-time graph
- Acceleration is equal to the rate of change of velocity
- So, the acceleration of an oscillator at any time can be determined from the gradient of the velocity-time graph:

-
- The maximum value of the acceleration is when the oscillator is at its maximum displacement
Worked Example
A swing is pulled 5 cm and then released.The variation of the horizontal displacement x of the swing with time t is shown on the graph below.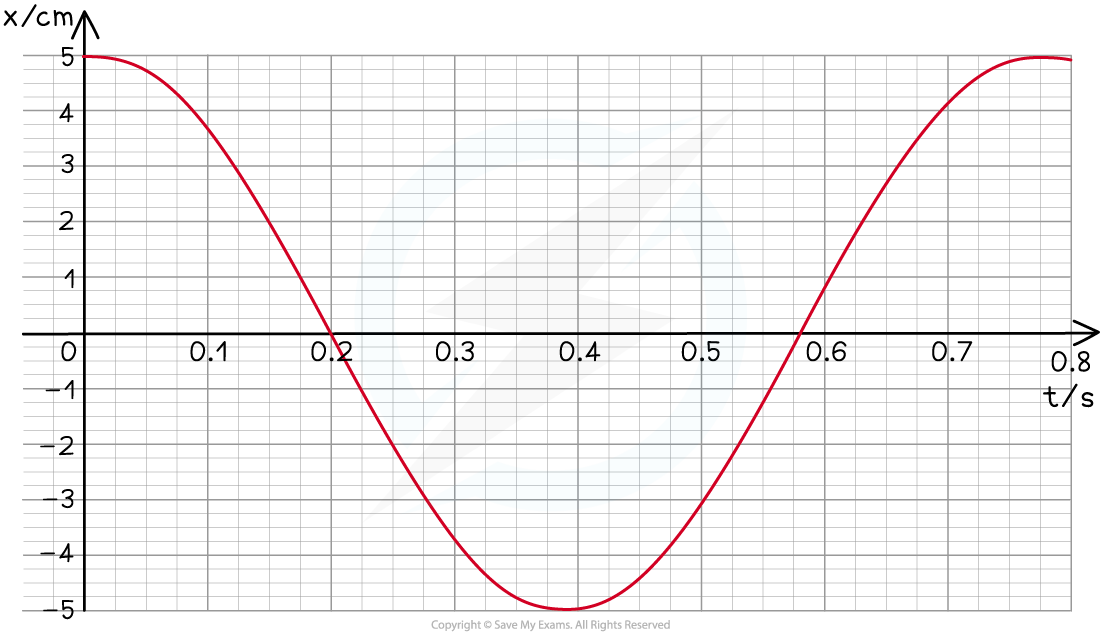 The swing exhibits simple harmonic motion.Use data from the graph to determine at what time the velocity of the swing is first at its maximum.
Step 1: The velocity is at its maximum when the displacement x = 0
Step 2: Reading value of time when x = 0
From the graph this is equal to 0.2 s
Exam Tip
These graphs might not look identical to what is in your textbook, depending on where the object starts oscillating from at t = 0 (on either side of the equilibrium, or at the equilibrium). However, if there is no damping, they will all always be a general sine or cosine curves.
转载自savemyexams

翰林AMC8视频课重磅上线!

国际竞赛真题资源免费领取







