- 翰林提供学术活动、国际课程、科研项目一站式留学背景提升服务!
- 400 888 0080
AQA A Level Physics复习笔记4.3.7 Required Practical: Determination of g
Required Practical: Determination of g
Aims of the Experiment
- The overall aim of the experiment is to calculate the value of the acceleration due to gravity, g
- This is done by measuring the time it takes for a ball-bearing to fall a certain distance. The acceleration is then calculated using an equation of motion
Variables
- Independent variable = height, h
- Dependent variable = time, t
- Control variables:
- Same steel ball–bearing
- Same electromagnet
- Distance between ball-bearing and top of the glass tube
Equipment List
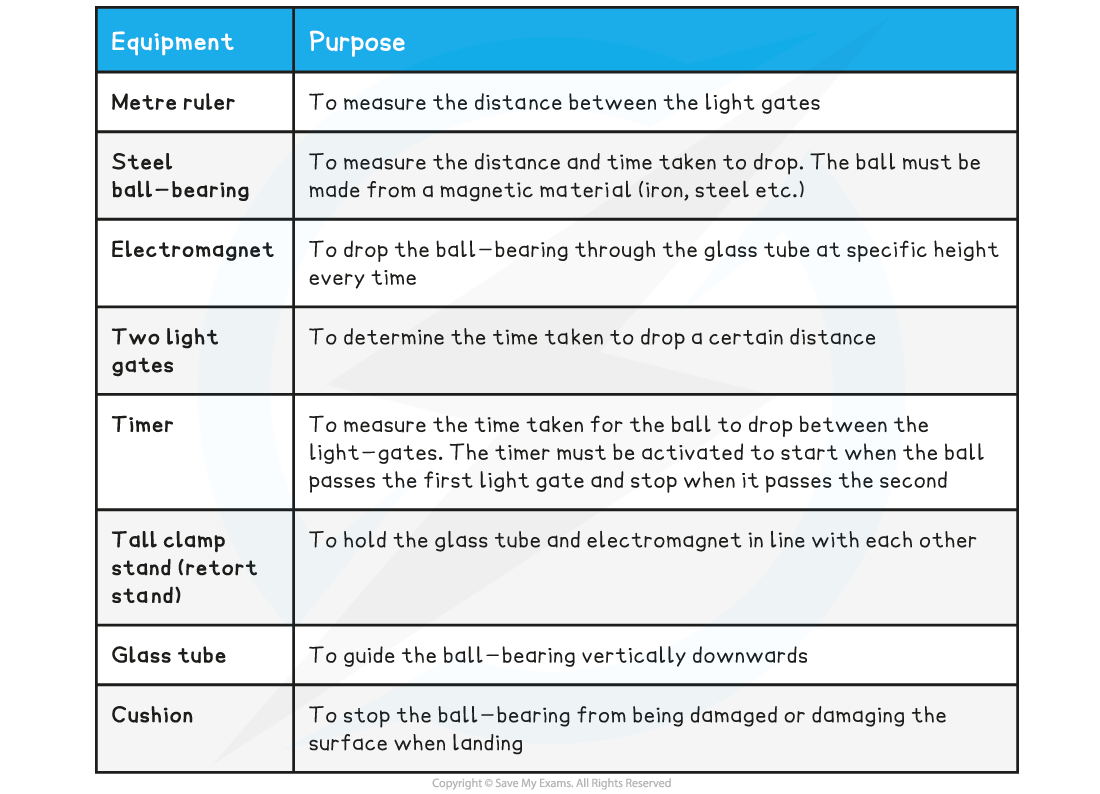
- Resolution of measuring equipment:
- Metre ruler = 1 mm
- Timer = 0.01 s
Method
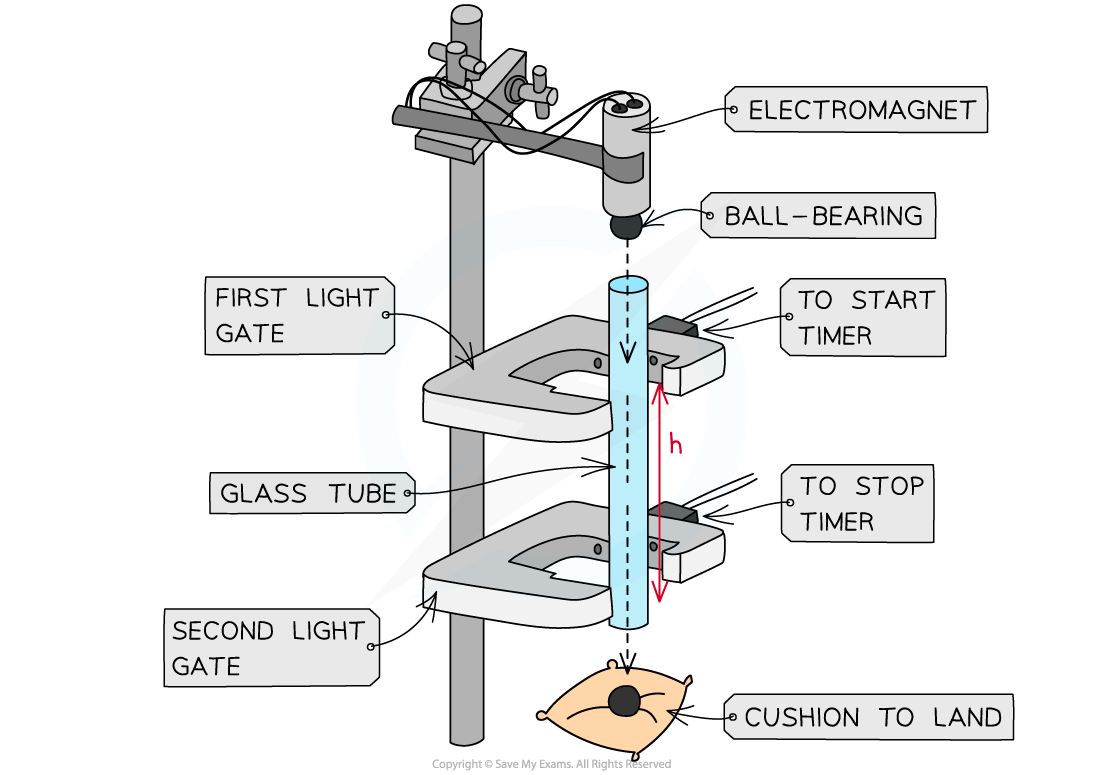
Apparatus set up to measure the distance and time for the ball bearing to drop
This method is an example of the procedure for varying the height the ball-bearing falls and determining the time taken – this is just one possible relationship that can be tested
- Set up the apparatus by attaching the electromagnet to the top of a tall clamp stand. Do not switch on the current till everything is set up
- Place the glass tube directly underneath the electromagnet, leaving space for the ball-bearing. Make sure it faces directly downwards and not at an angle
- Attach both light gates around the glass tube at a starting distance of around 10 cm
- Measure this distance between the two light gates as the height, h with a metre ruler
- Place the cushion directly underneath the end of the glass tube to catch the ball-bearing when it falls through
- Switch the current on the electromagnet and place the ball-bearing directly underneath so it is attracted to it
- Turn the current to the electromagnet off. The ball should drop
- When the ball drops through the first light gate, the timer starts
- When the ball drops through the second light gate, the timer stops
- Read the time on the timer and record this as time, t
- Increase h (eg. by 5 cm) and repeat the experiment. At least 5 – 10 values for h should be used
- Repeat this method at least 3 times for each value of h and calculate an average t for each
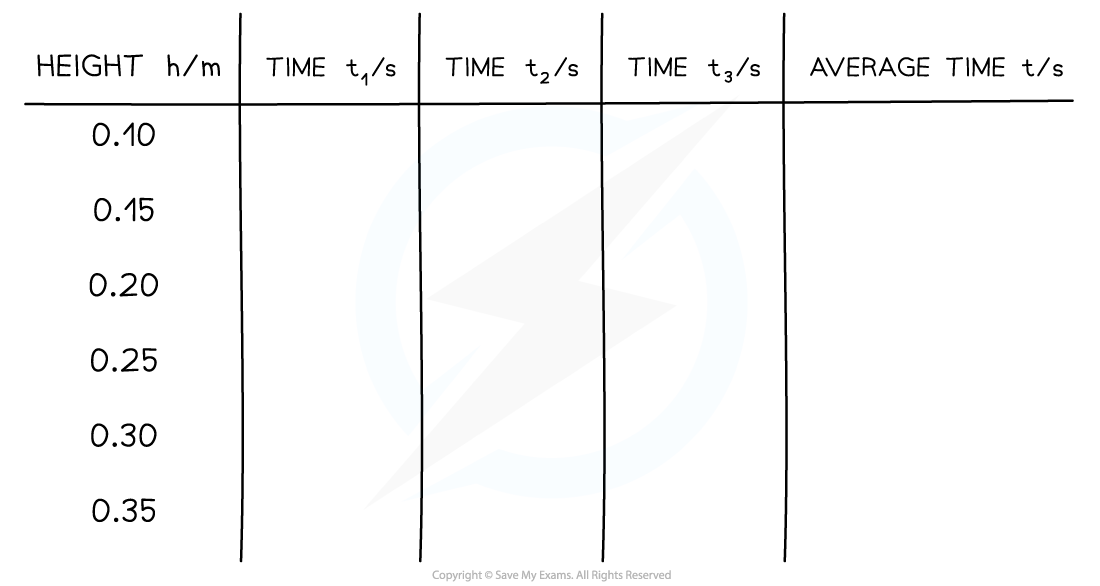
- An example of a table with some possible heights would look like this:
Example Table of Results
Analysis of Results
- The acceleration is found by using one of the SUVAT equations
- The known quantities are
- Displacement s = h
- Time taken = t
- Initial velocity u = u
- Acceleration a = g
- The following SUVAT equation can be rearranged:

- Substituting in the values and rearranging it as a straight line equation gives:

- Comparing this to the equation of a straight line: y = mx + c
- y = 2h/t (m s-1)
- x = t
- Gradient, m = a = g (m s–2)
- y-intercept = 2u
- Plot a graph of the 2h/t against t
- Draw a line of best fit
- Calculate the gradient - this is the acceleration due to gravity g
- Assess the uncertainties in the measurements of h and t. Carry out any calculations needed to determine the uncertainty in g due to these
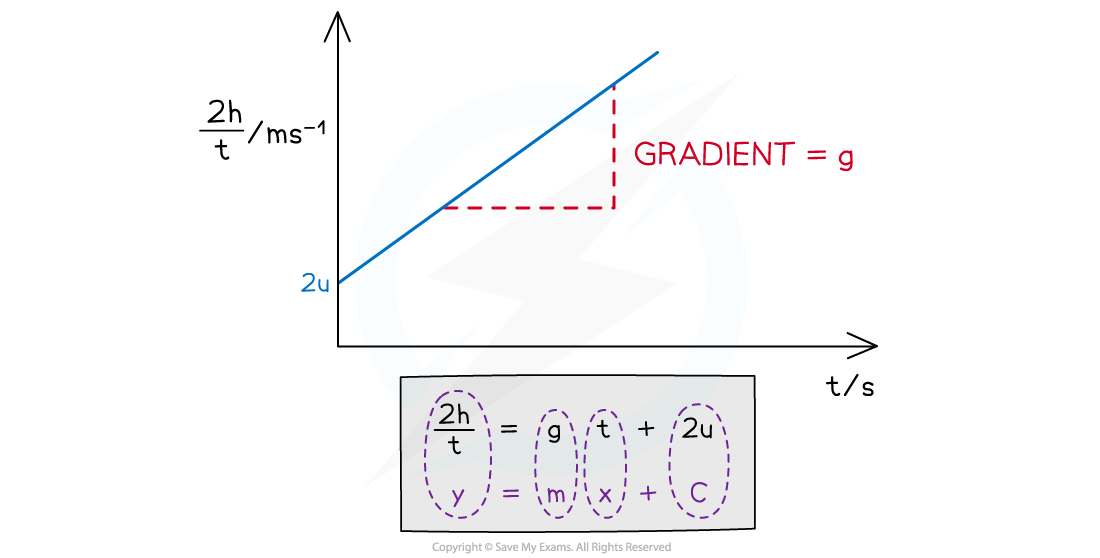
The graph of 2h/t against t produces a straight-line graph where the acceleration is the gradient
Evaluating the Experiment
Systematic Errors:
- Residue magnetism after the electromagnet is switched off may cause t to be recorded as longer than it should be
Random Errors:
- Large uncertainty in h from using a metre rule with a precision of 1 mm
- Parallax error from reading h
- The ball may not fall accurately down the centre of each light gate
- Random errors are reduced through repeating the experiment for each value of h at least 3-5 times and finding an average time, t
Safety Considerations
- The electromagnetic requires current
- Care must be taken to not have any water near it
- To reduce the risk of electrocution, only switch on the current to the electromagnet once everything is set up
- A cushion or a soft surface must be used to catch the ball-bearing so it doesn’t roll off / damage the surface
- The tall clamp stand needs to be attached to a surface with a G clamp so it stays rigid
Worked Example
A student investigates the relationship between the height that a ball-bearing is dropped between two light gates and the time taken for it to drop.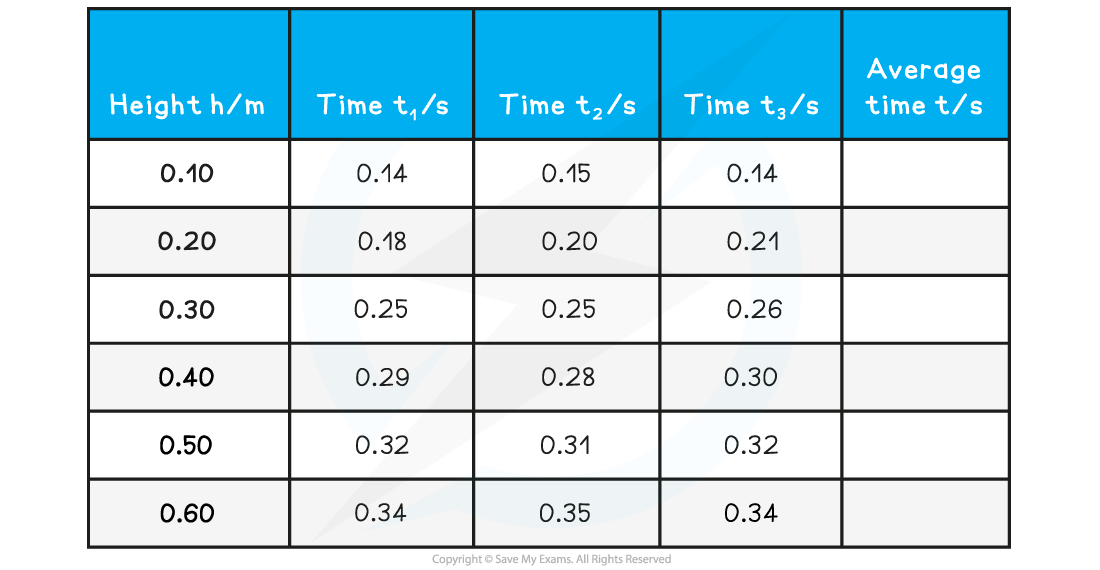 Calculate the value of g from the table.
Step 1: Complete the table
Calculate the average time for each height
Add an extra column 2h / t
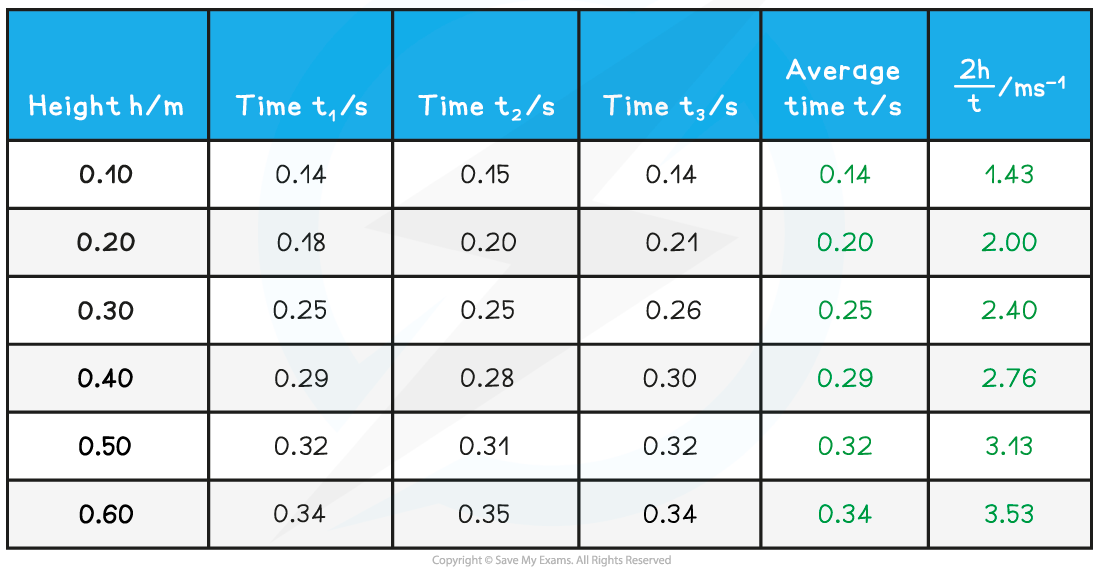
Step 2: Draw graph of 2h/t against time t

Make sure the axes are properly labelled and the line of best fit is drawn with a ruler
Step 3: Calculate the gradient of the graph
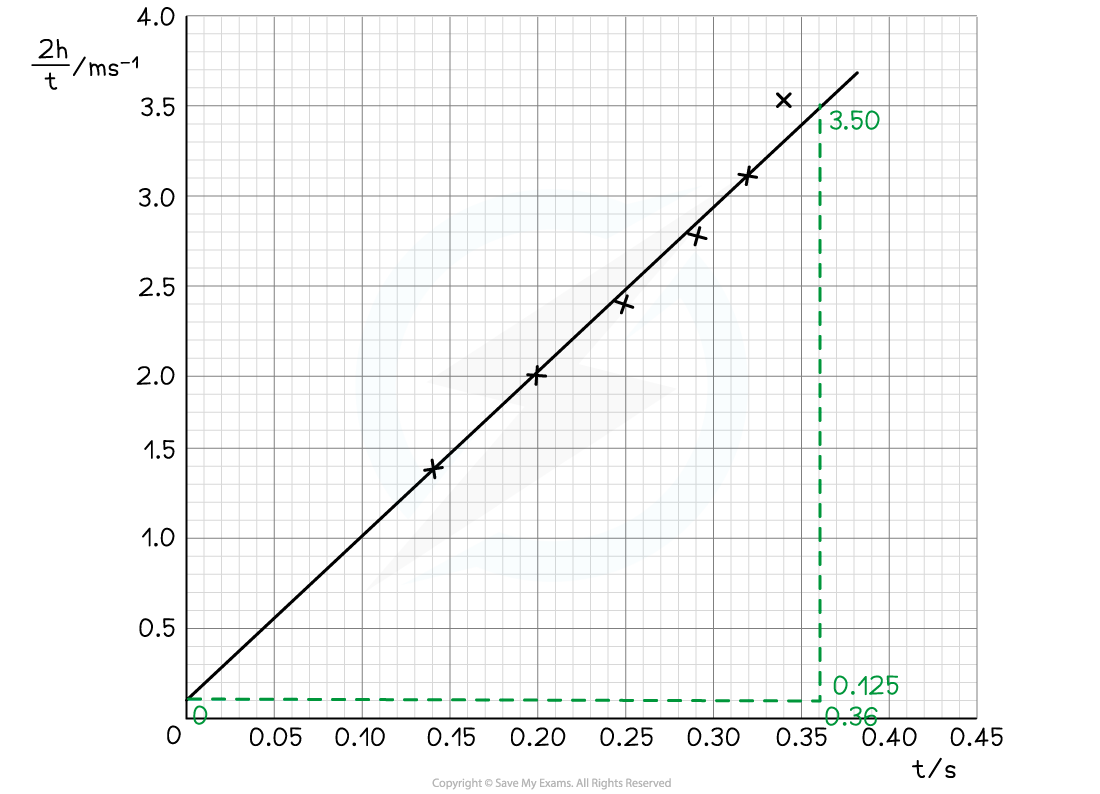
The gradient is calculated by:

转载自savemyexams


最新发布
© 2025. All Rights Reserved. 沪ICP备2023009024号-1


