- 翰林提供学术活动、国际课程、科研项目一站式留学背景提升服务!
- 400 888 0080
AQA A Level Chemistry复习笔记8.3.4 Required Practical 12
Separation of species by TLC
Required practical 12: Separation of species by thin-layer chromatography
- This practical covers two key laboratory skills
- use thin-layer or paper chromatography
- safely and carefully handle solids and liquids, including corrosive, irritant, flammable and toxic substances
- A suitable experiment for this is the analysis of common analgesics by thin-layer chromatography
Key steps in the procedure
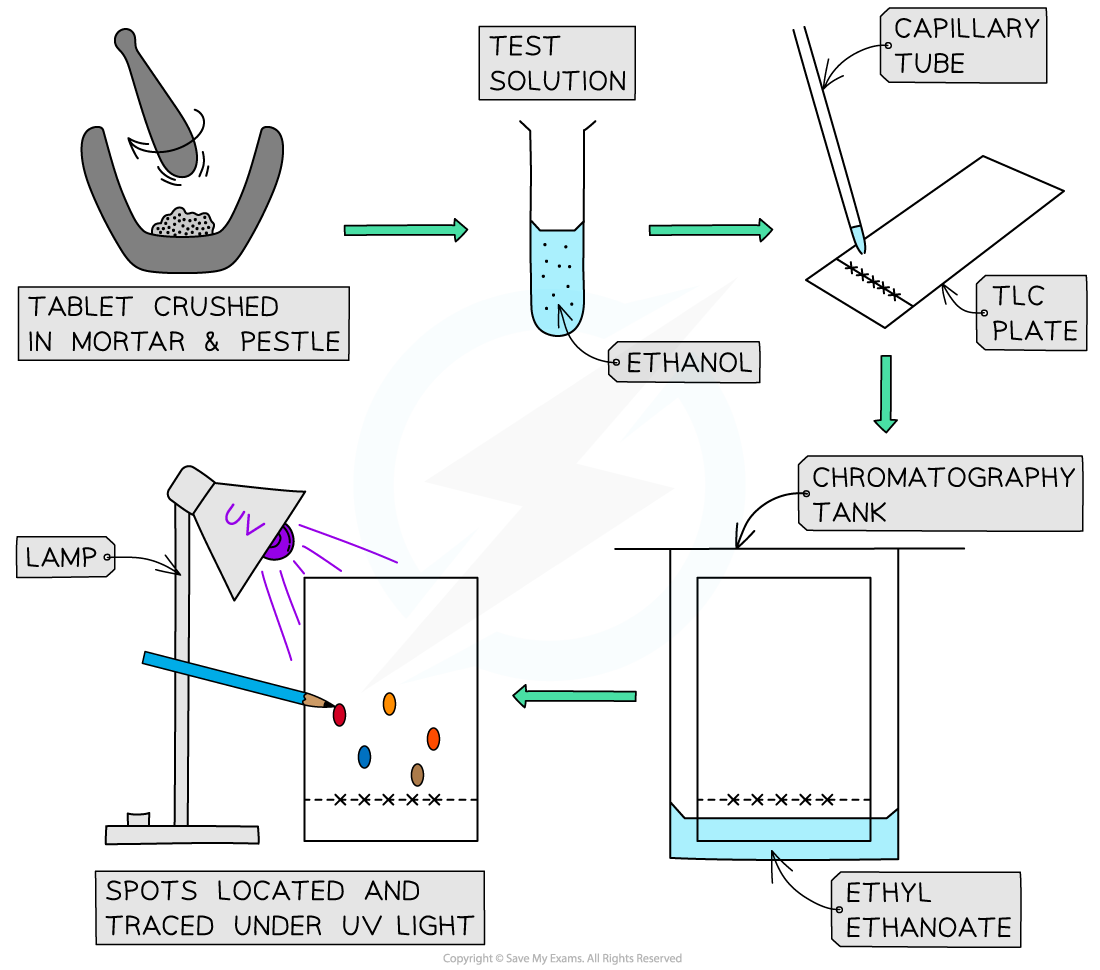
- An aspirin tablet is crushed using a mortar and pestle and 0.1 g of the powder is weighed out into suitable container such as a small test tube
- The powder is dissolved in 0.5 cm3 of ethanol
- Tablets of ibuprofen and paracetamol are prepared in the same way
- The procedure is repeated with a caffeine tablet and an Anadin Extra tablet, this time using 7 cm3 of ethanol to dissolve the crushed solid

Steps in the TLC analysis of some common analgesics
Running the TLC
- Prepare a beaker with a small quantity of ethyl ethanoate
- On a TLC plate, draw a fine horizontal line at the bottom edge (in pencil)
- This is called the baseline
- Draw five small crosses in pencil where the five spots will be located
- Use a capillary tube to draw up a small amount of the test solutions and transfer it to the crosses
- Do not allow the spots to become too large as the quality of the separation will be affected
- Place the TLC plate inside a chromatography tank or beaker with solvent – making sure that the solvent does not cover the spot – and place a lid to cover the beaker
- The solvent will begin to travel up the plate, dissolving the compounds as it does
- A lid is need to prevent evaporation of the solvent (it also may be harmful)
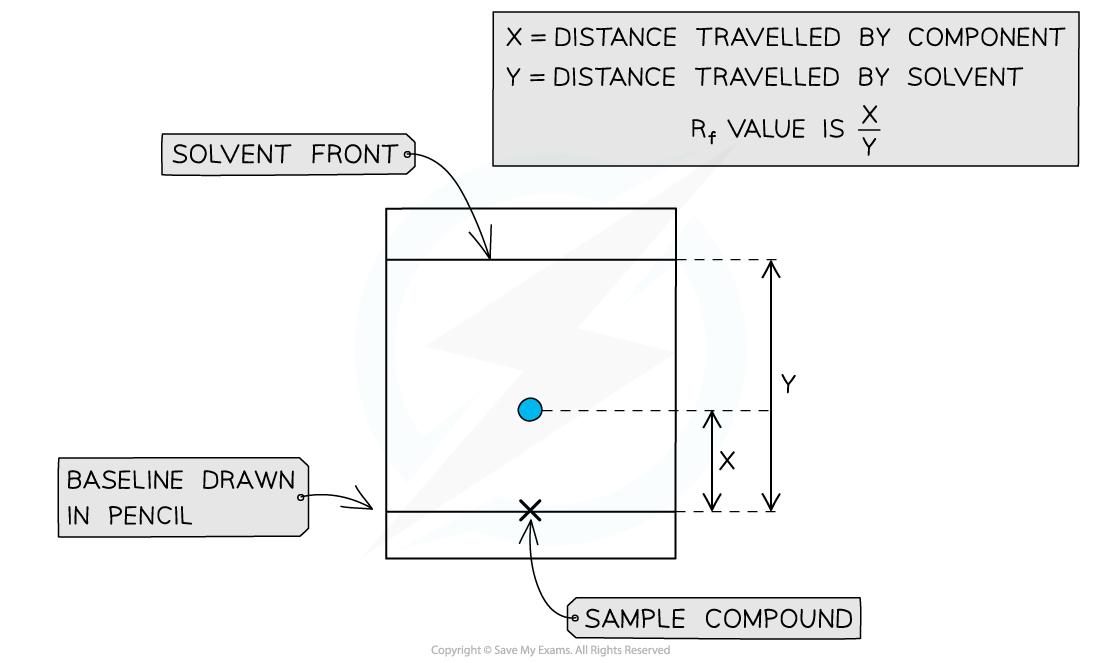
- As solvent reaches the top, remove the plate and draw another pencil line where the solvent has reached, indicating the solvent front
- The spots will be visible under a UV lamp, so allow the TLC plate to dry and use a pencil to draw around the spots under UV light
- The Rf values of the spots can then be calculated
Finding the Rf values
- A TLC plate can be used to calculate Rf values for compounds

- These values can be used alongside other analytical data to deduce composition of mixtures

Rf values can be calculated by taking 2 measurements from the TLC plate
转载自savemyexams

早鸟钜惠!翰林2025暑期班课上线

最新发布
© 2025. All Rights Reserved. 沪ICP备2023009024号-1


