AQA A Level Chemistry复习笔记5.2.6 Concentration-Time Graphs

Concentration-Time Graphs
Order of reaction from concentration-time graphs
- In a zero-order the concentration of the reactant is inversely proportional to time
- This means that the concentration of the reactant decreases with increasing time
- The graph is a straight line going down
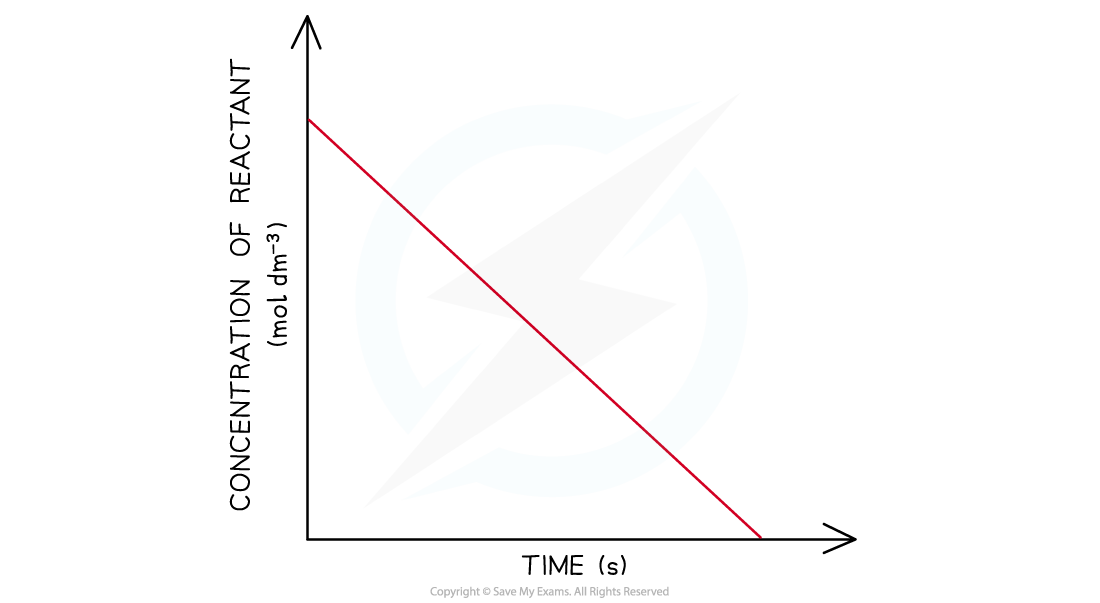
Concentration-time graph of a zero-order reaction
- In a first-order reaction the concentration of the reactant decreases with time
- The graph is a curve going downwards and eventually plateaus
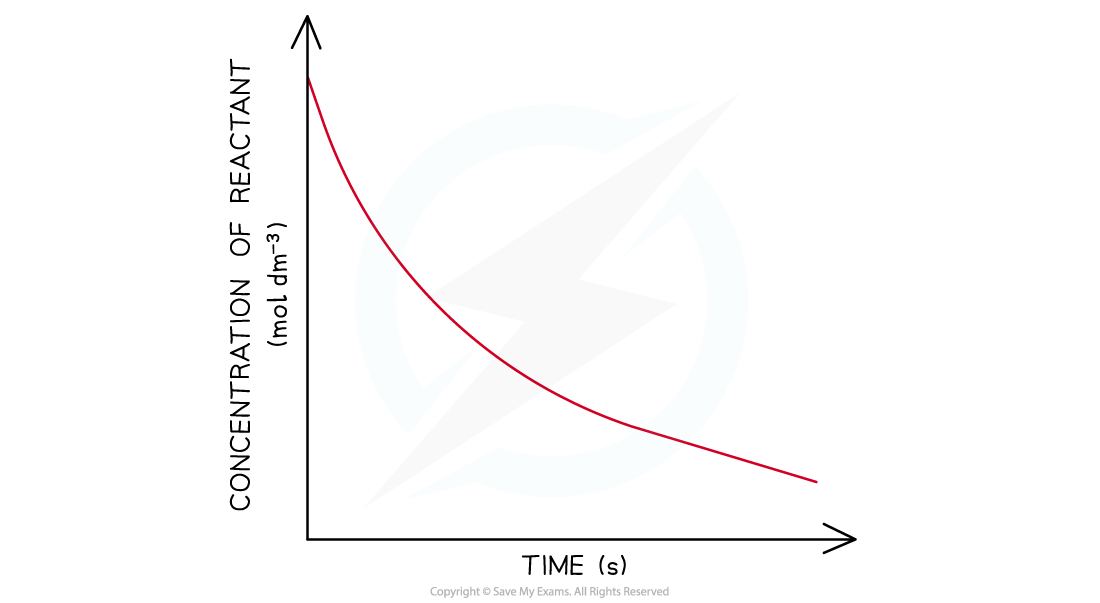
Concentration-time graph of a first-order reaction
- In a second-order reaction the concentration of the reactant decreases more steeply with time
- The concentration of reactant decreases more with increasing time compared to in a first-order reaction
- The graph is a steeper curve going downwards
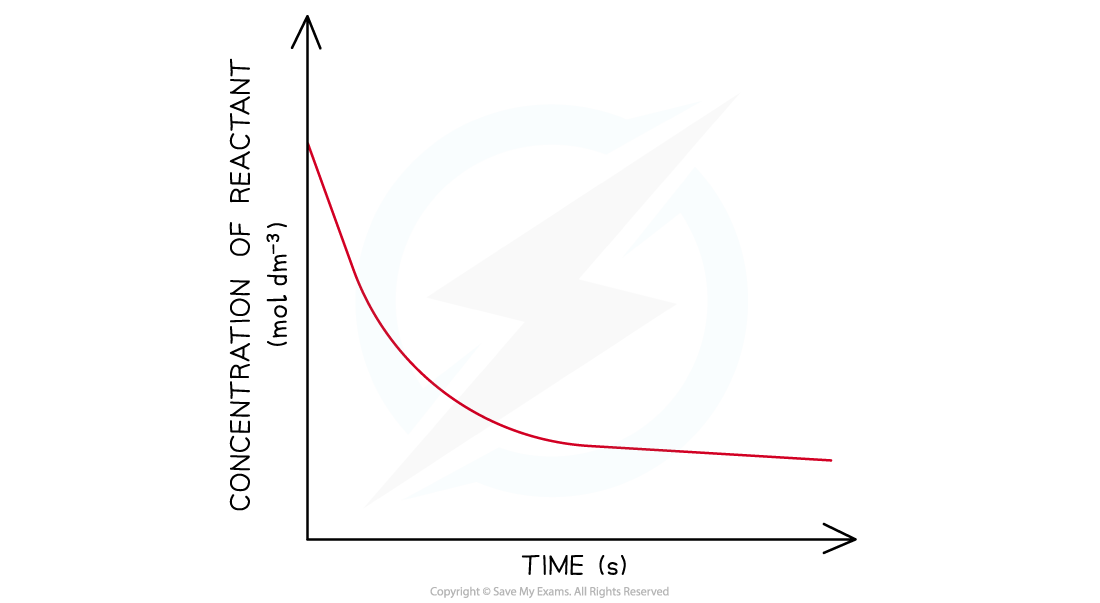
Concentration-time graph of a second-order reaction
Initial Rates Method
The Initial Rate Method
- The initial rate method is used to gather experimental data, to determine the order with respect to the reactants in the reaction
- The initial rate of a reaction is the rate right at the start of the reaction
- This is used because right at the start of the reaction, we know the exact concentration of the reactants used
- The method involves setting up a series of experiments
- When carrying out the experiments:
- The temperature must remain constant
- For each experiment, the concentration of only of the reactants is altered - the rest must remain constant
- The experiments are planned so that when the results are collected, they can be used to determine the order with respect to each reactant
- For each experiment, a concentration-time graph is drawn
- From each graph, the initial rate is calculated by drawing a tangent to the line at t = 0 and calculating the gradient
- The gradient at t = 0 is the initial rate for that reaction
General Example
- Let's take the following general reaction as an example
2A + B + C → C + D
- We need to run a series of experiments at different concentrations of A, B and C, to determine how each affects the initial rate of the reaction
- Firstly, complete the experiment using the same concentration of A, B and C
- In another experiment, change the concentration of A but keep the concentrations of B and C the same as in experiment 1
- In a third experiment, change the concentration of B but keep the concentrations of A and C the same as in experiment 1
- And so on, until you have completed a series of experiments and collected the results
- Draw graphs for each experiment, draw a tangent at t=0 and calculate the gradient (the initial rate) for each graph
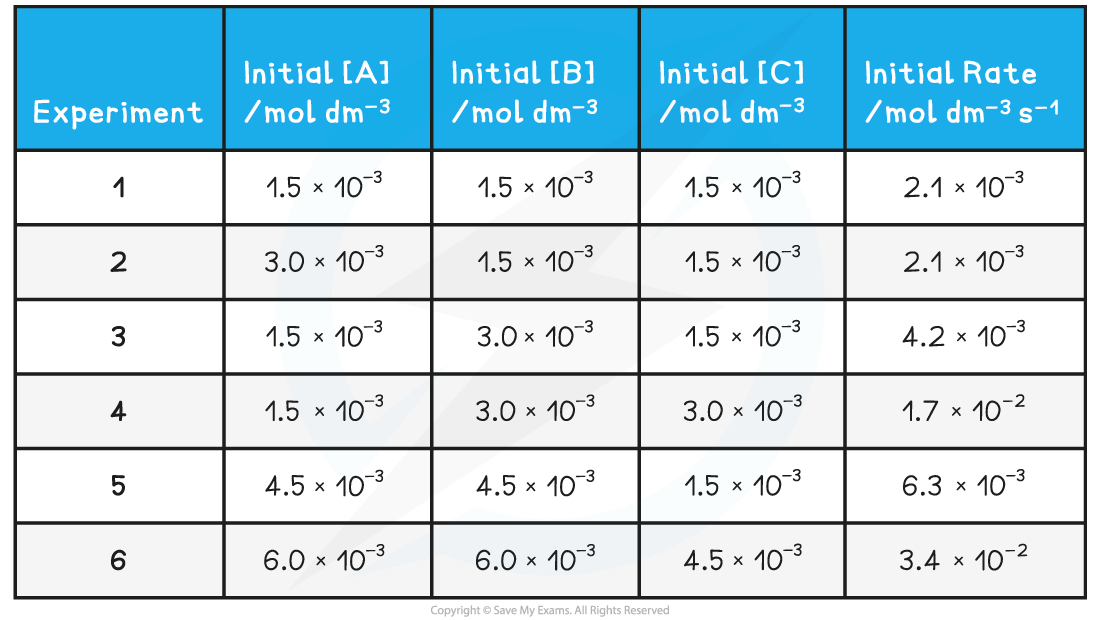
- Tabulate all of your results, and then use these to determine the order with respect to each reactant, to determine the rate equation for the reaction
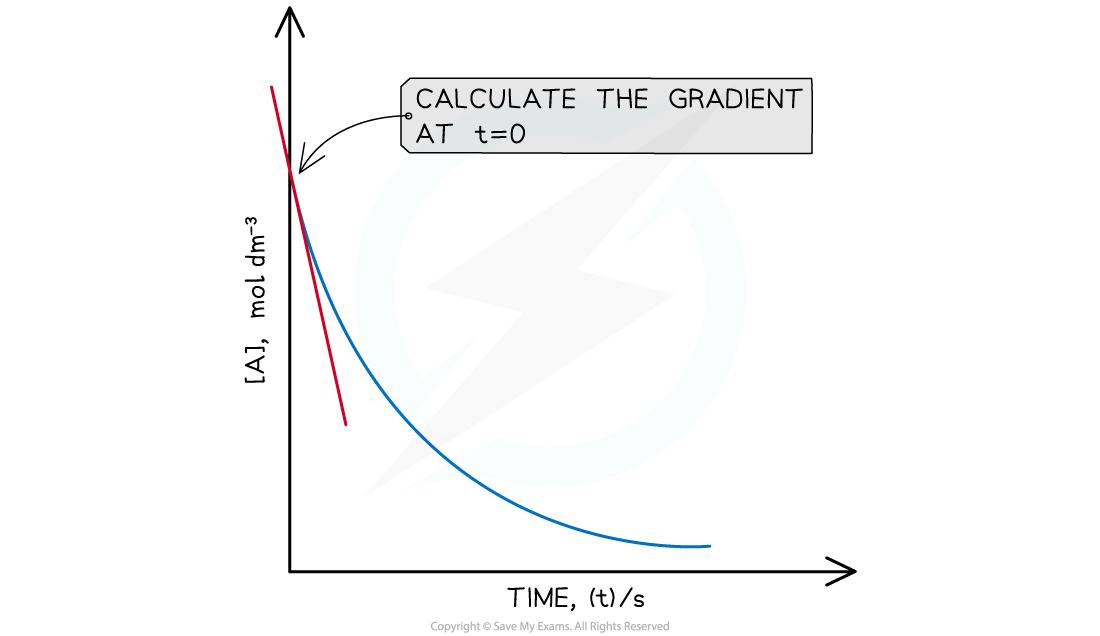
A graph to show how to find the initial rate of a reaction (t=0)
Table of the results collected for the reaction
Rate Constant & Zero Order Graphs
Finding the Rate Constant of a Zero Order Reaction
- As shown above, a zero order reaction will give the following concentration-time graph
Concentration-time graph of a zero-order reaction
- The rate of the reaction isn't changing - if you were to calculate the gradient at different points on the graph, you would achieve a constant value
- Since the order with respect to the reactant is 0, a change in the concentration of the reactant will have no effect on the rate of the reaction
- Therefore:
Rate = k
- The rate of the reaction is the gradient of the graph, meaning that the rate constant, k, for the reaction will also be the gradient of the graph
转载自savemyexams
以上就是关于【AQA A Level Chemistry复习笔记5.2.6 Concentration-Time Graphs】的解答,如需了解学校/赛事/课程动态,可至翰林教育官网获取更多信息。
往期文章阅读推荐:
翰林独家 | 经济学竞赛核心精讲,一册打通NEC/IEO/USAEBO!
2026 ALEVEL 夏考A率出炉!爱德思vs牛津AQA,哪些科目真的“好出分”?


翰林AMC8视频课重磅上线!

国际竞赛真题资源免费领取






