- 翰林提供学术活动、国际课程、科研项目一站式留学背景提升服务!
- 400 888 0080
Edexcel IGCSE Maths 复习笔记 6.3.1 Cumulative Frequency
Edexcel IGCSE Maths 复习笔记 6.3.1 Cumulative Frequency
What does cumulative frequency mean?
- Cumulative basically means “adding up as you go along”
- So cumulative frequency means all of the frequencies for the different classes, totalled
- This allows us to draw a cumulative frequency graph, from which we can find useful information such as the median and quartiles
What do I need to know?
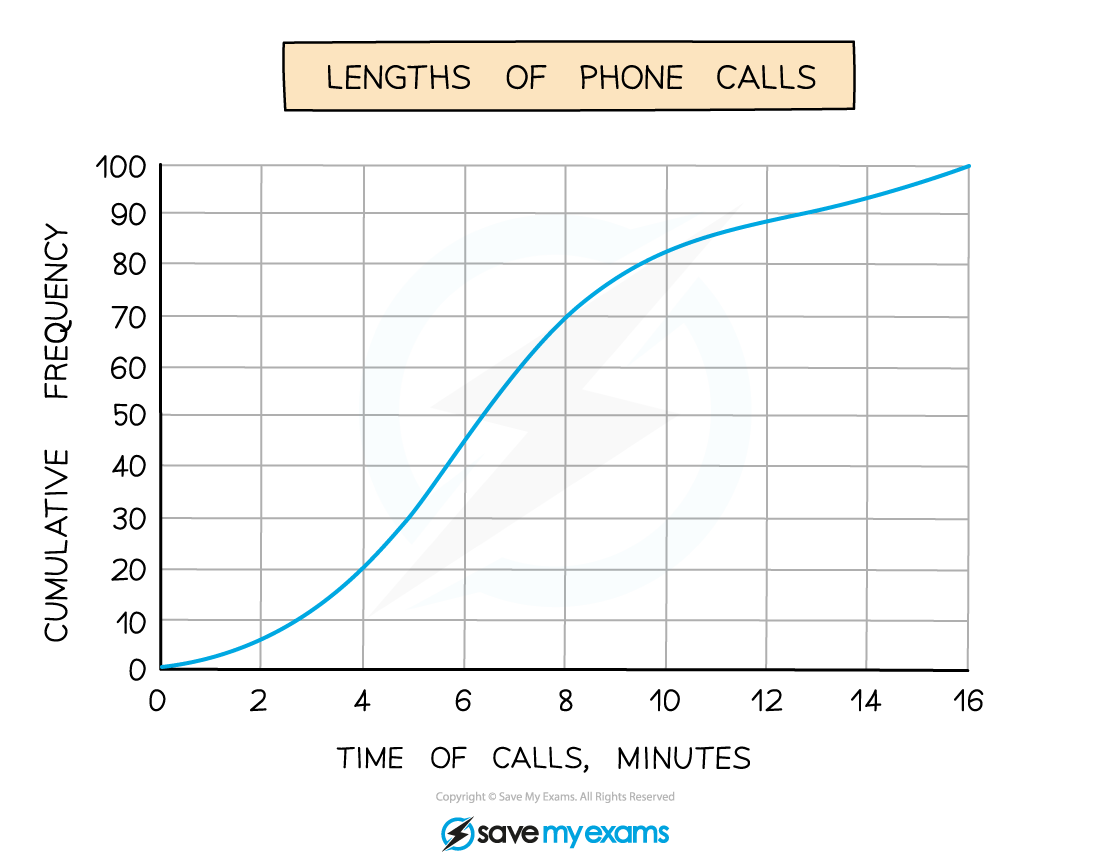
- You will either be asked to draw a cumulative frequency graph or analyse one
- It is also possible to draw a box plot from a cumulative frequency graph and you could be asked to compare the data with another set of data (see Box Plots)
1. Drawing a cumulative frequency graph
- This is best explained with an example
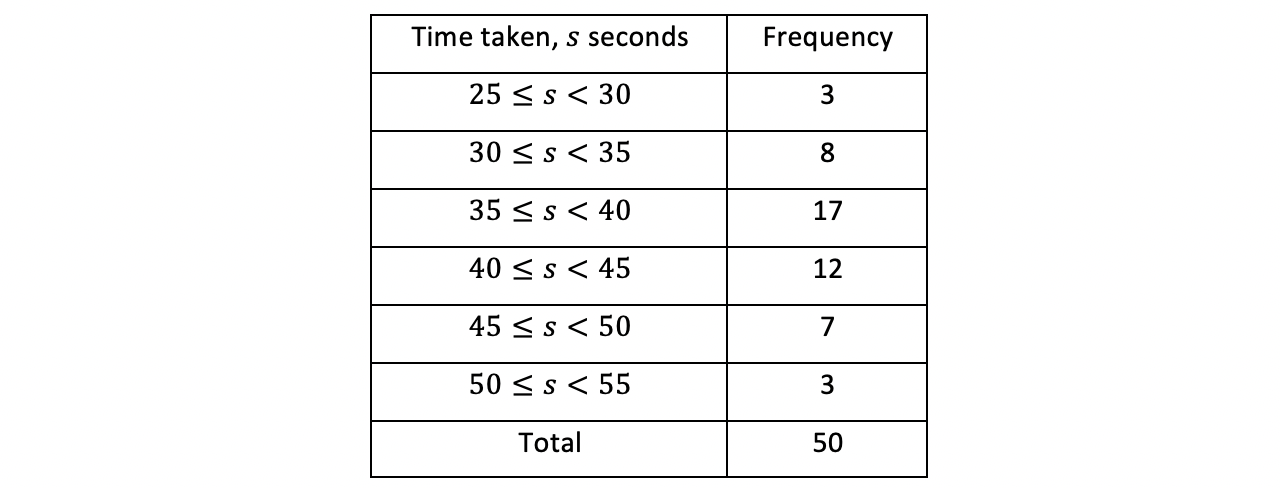
- For example, the times taken to complete a short general knowledge quiz taken by 50 students are shown in the table below:
- When asked to find the cumulative frequencies you may be given another table – or the table above will have an extra column on it
- You should be aware of both possibilities although the process is the same
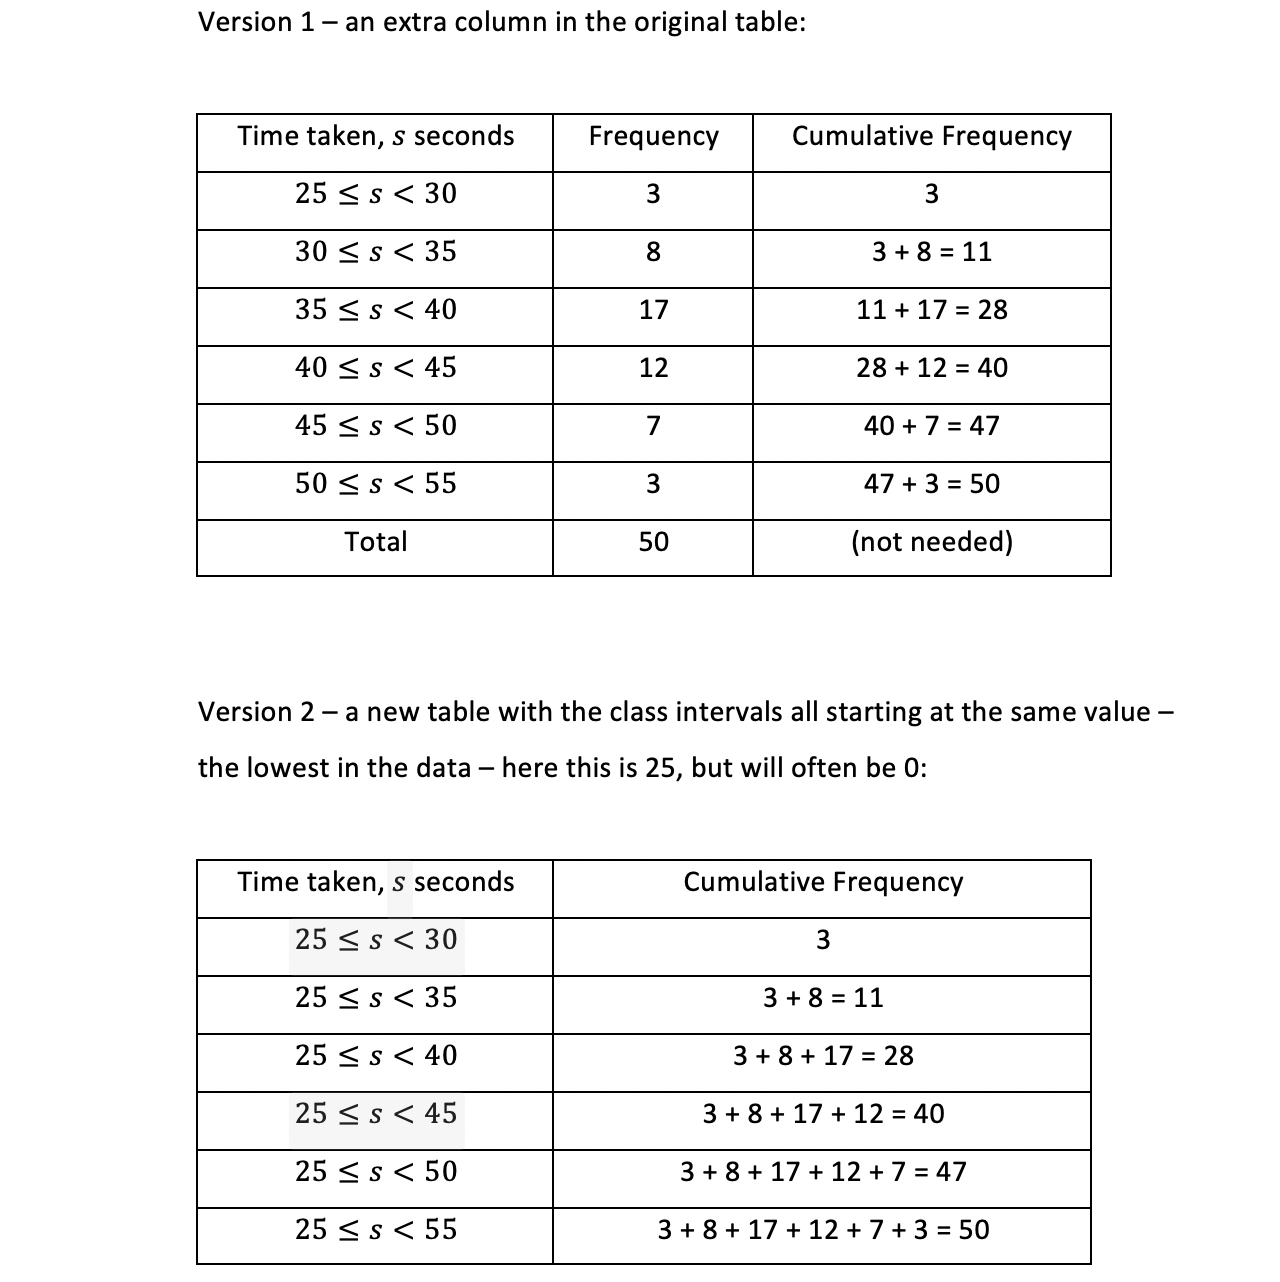
- Note the cumulative frequencies are found in exactly the same way whichever version you may come across but we’ve shown two different ways of thinking about it
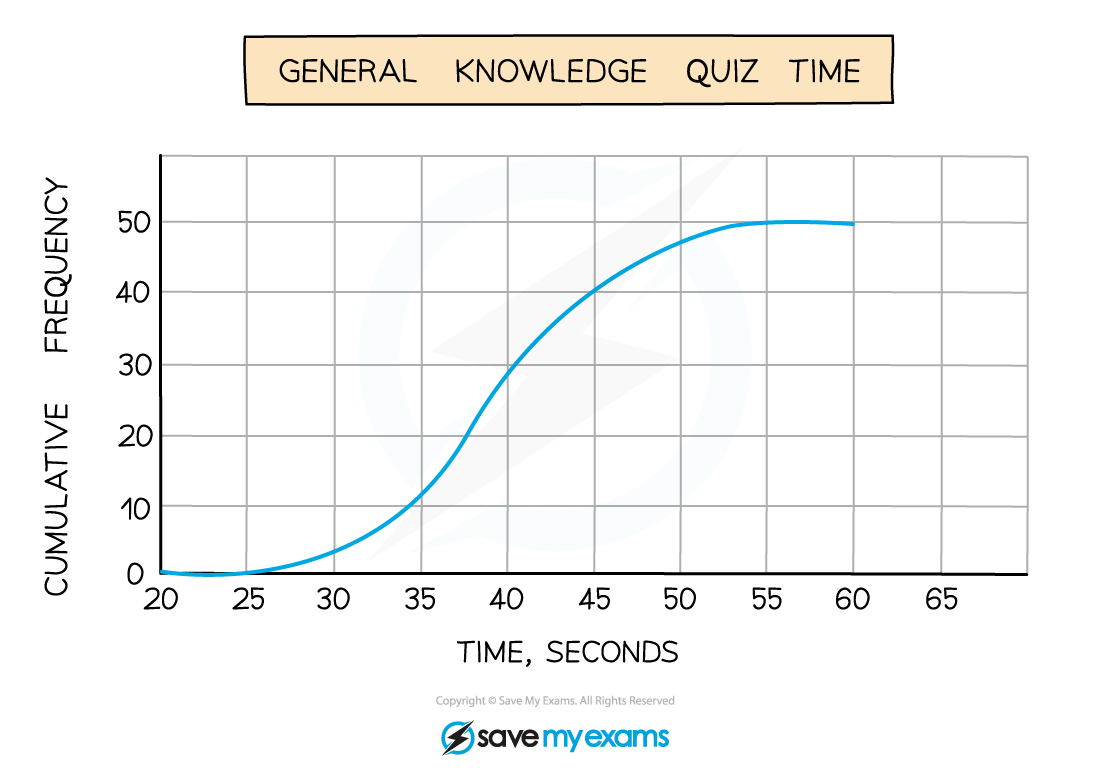
- Now you have your cumulative frequencies you can draw a graph from it
- The key here is that cumulative frequencies are plotted against the end (upper bound) of the class interval
- This is because you can’t say, for example, you have covered all 11 students (2nd row of table) until you have reached 35 seconds
- After 30 seconds (start) only 3 people had finished the quiz and you cannot tell how many had finished by 32.5 seconds (midpoint)
Worked Example

Worked Example
Worked Example
(a)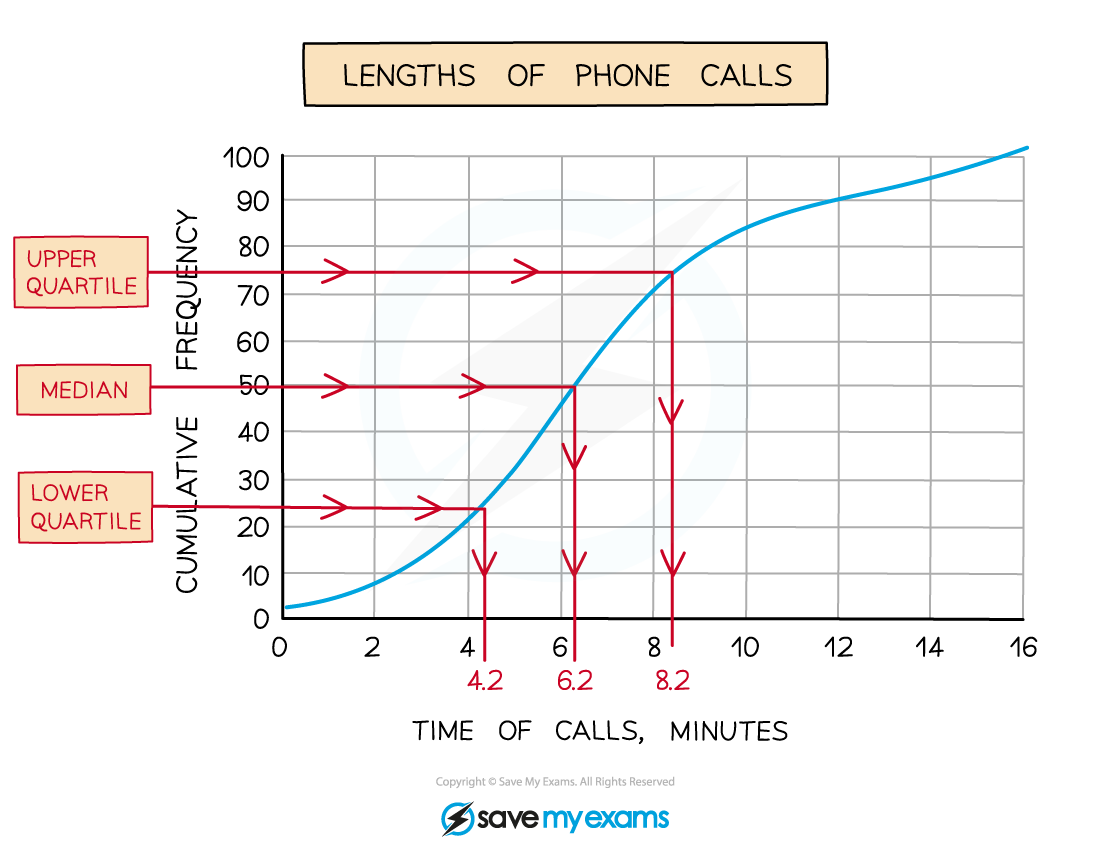
Worked Example
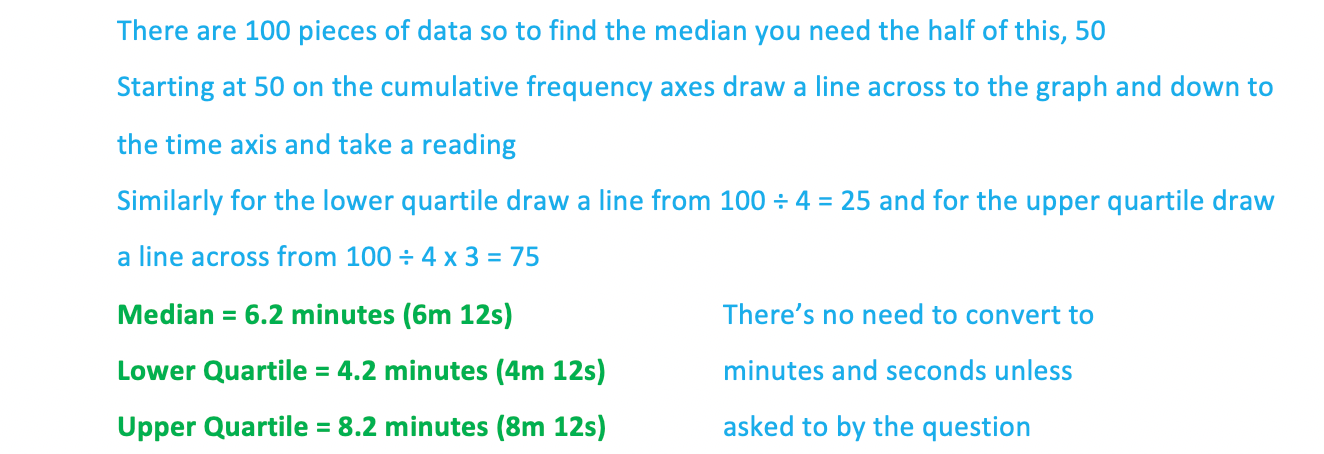
Worked Example
(b)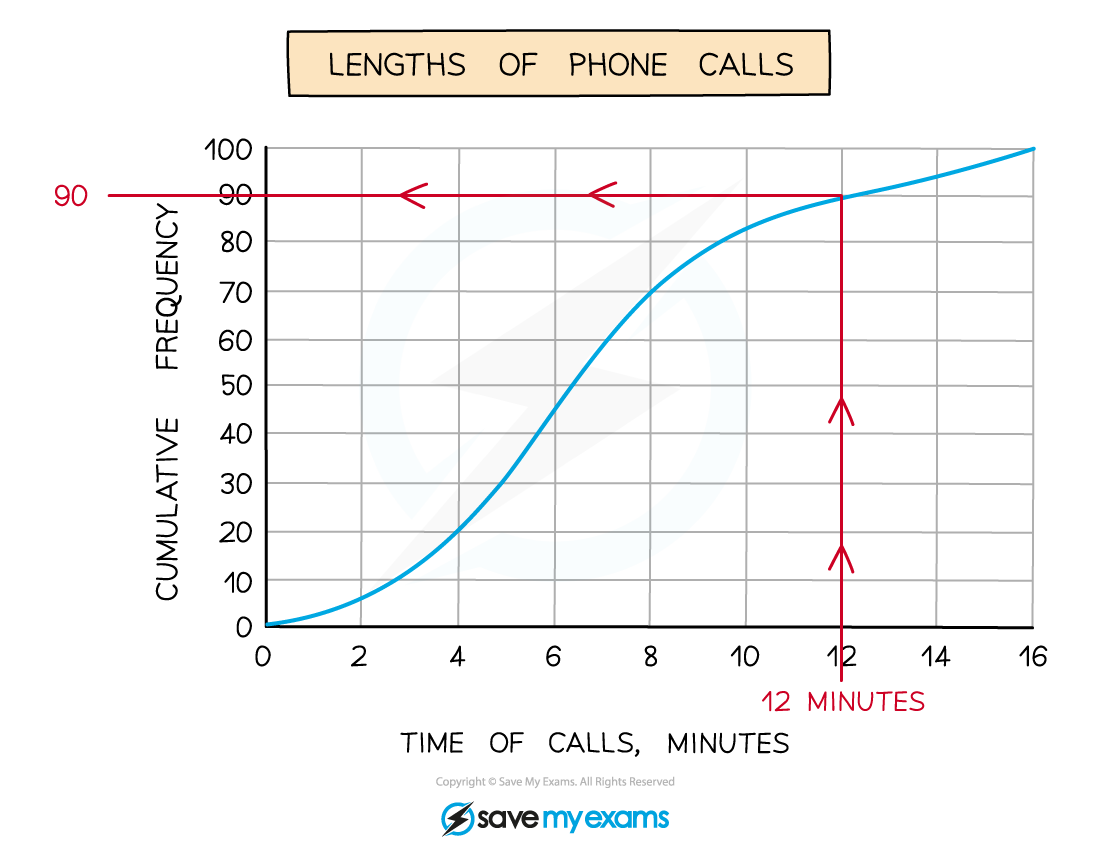
Worked Example

转载自savemyexam


最新发布
© 2025. All Rights Reserved. 沪ICP备2023009024号-1


