Edexcel IGCSE Maths 复习笔记 6.2.1 Histograms

Edexcel IGCSE Maths 复习笔记 6.2.1 Histograms
Aren’t histograms just really hard bar charts?
- No! There are many mathematical differences that you should be aware of but the key difference between a bar chart and a histogram is that with a histogram it is the area of the bars that determine the frequency, on a bar chart it’s the height (or length) of them
- Digging deeper, histograms are used for continuous data (bar charts for discrete) and are particularly useful when data has been grouped into different sized classes
- But the key thing to getting started is that it is the area of the bars that tell us what is happening with the data
- This means, unlike any other graph or chart you have come across, it is very difficult to tell anything from simply looking at a histogram, you have to drill down into the numbers and detail
What do I need to know?
- You need to know how to draw a histogram (most questions will get you to finish an incomplete histogram)
- When drawing histograms we will need to use frequency density (fd):

- You’ll also need to be able to work backwards from a given histogram to find frequencies and estimate the mean
1. Drawing a histogram
- From a given table you need to work out the frequency density for each class
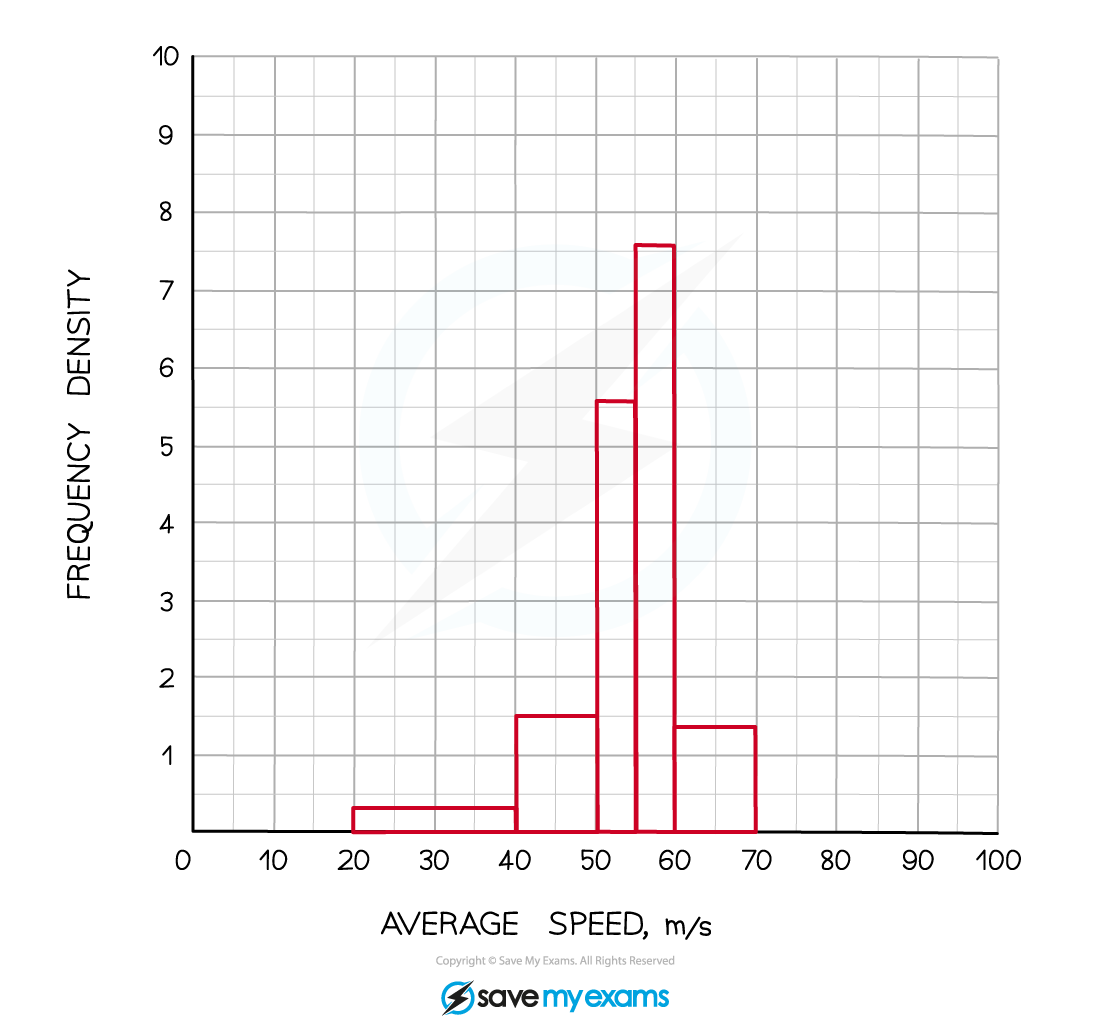
- Then you can plot the data against frequency density with frequency density on the -axis
- For example, plot a histogram for the following data regarding the average speed travelled by trains
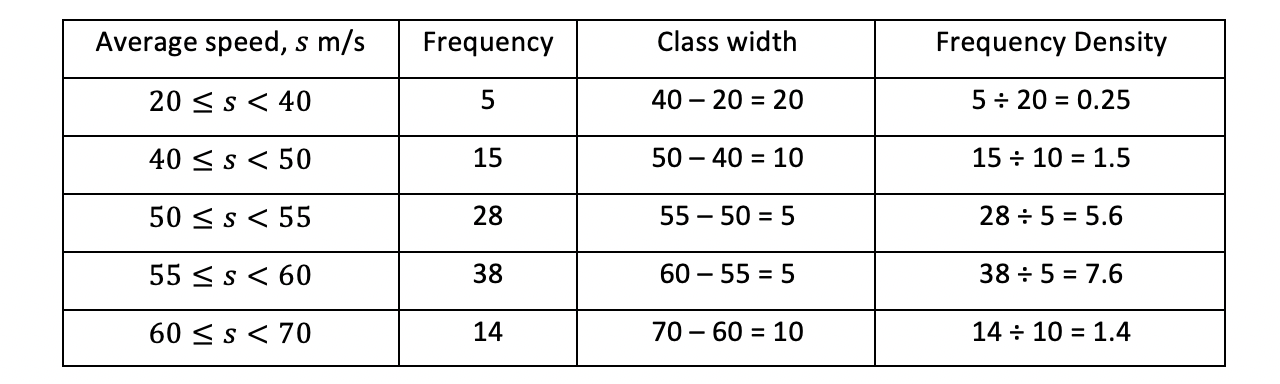
- Note that the class width column isn’t essential but it is crucial you show the frequency densities
- Now we draw bars (touching, as the data (speed) is continuous) with widths of the class intervals and heights of the frequency densities
2. Interpreting histograms
- We shall still use the example above here but shall pretend we never had the table of data and were only given the finished histogram
- To estimate the mean:
- You need to know the total frequency and what all the data values add up to
- You can’t find the exact total of the data values as this is grouped data but we can estimate it using midpoints
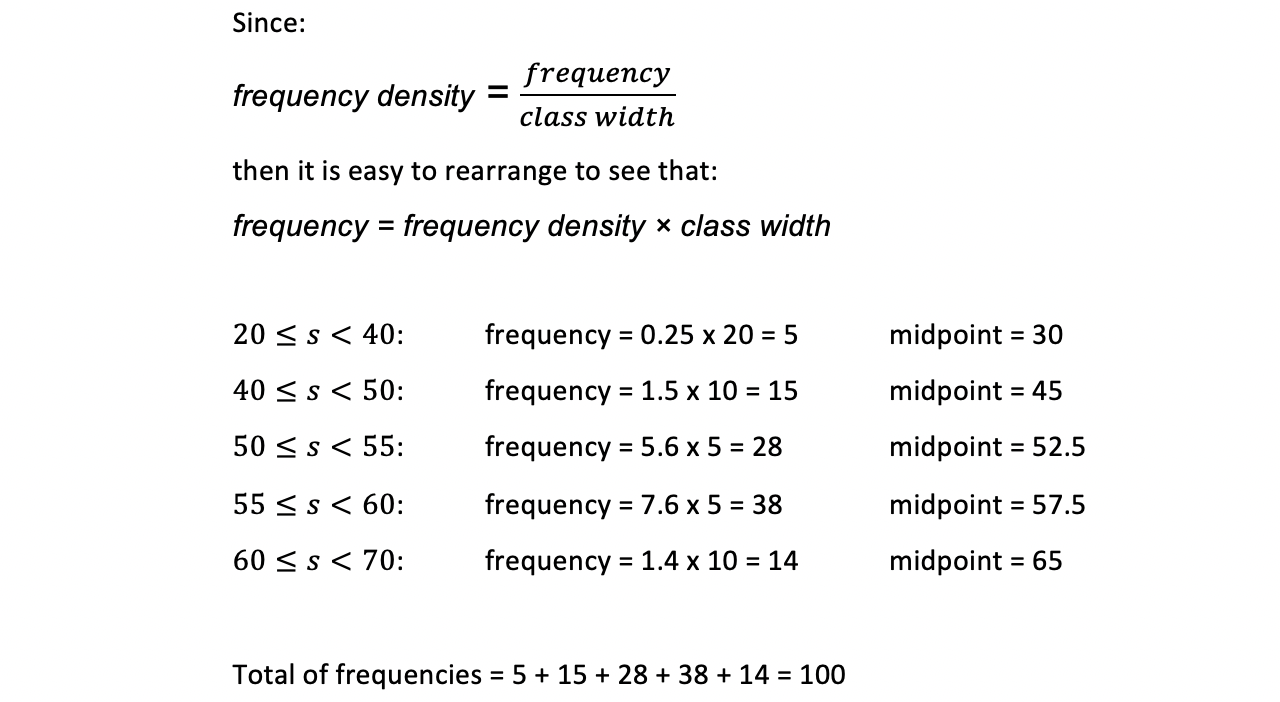
- You can draw all of the above in a table if you wish
- Now you can total up (an estimate of) the data values and find the mean:
Total = 5 x 30 + 15 x 45 + 28 x 52.5 + 38 x 57.5 + 14 x 65 = 5390
(Be careful if you type all this into your calculator in one go!)
Estimate of Mean = 5390 ÷ 100 = 53.9
Exam Tip
Always work out and write down the frequency densities. Many students lose marks in exams as they go straight to the graph when asked to draw a histogram and they mess up the calculations. Method marks are available for showing you know to use frequency density rather than frequency.
Worked Example

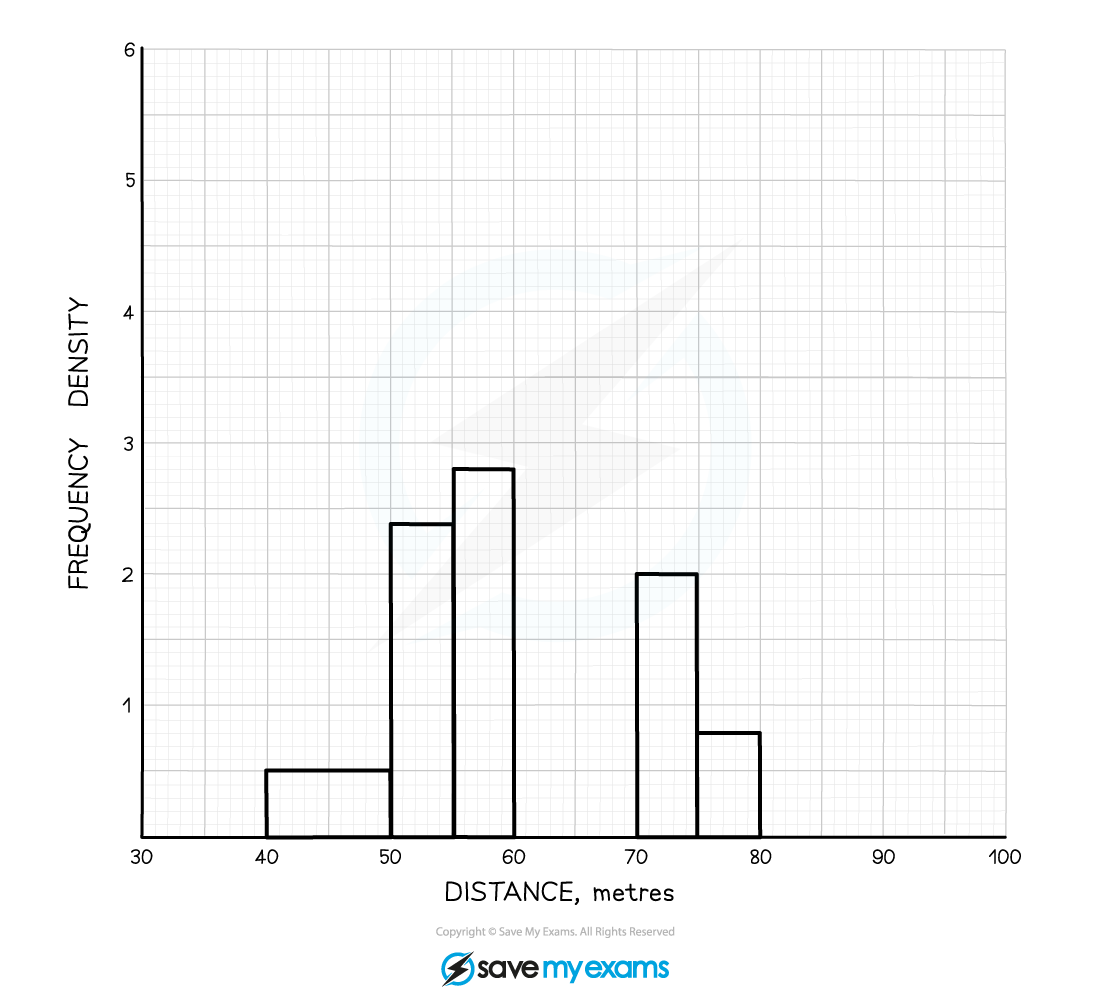
Worked Example
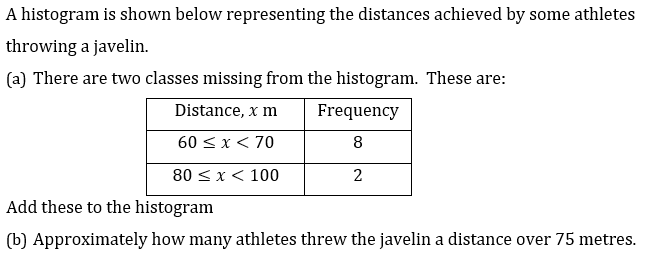
Worked Example
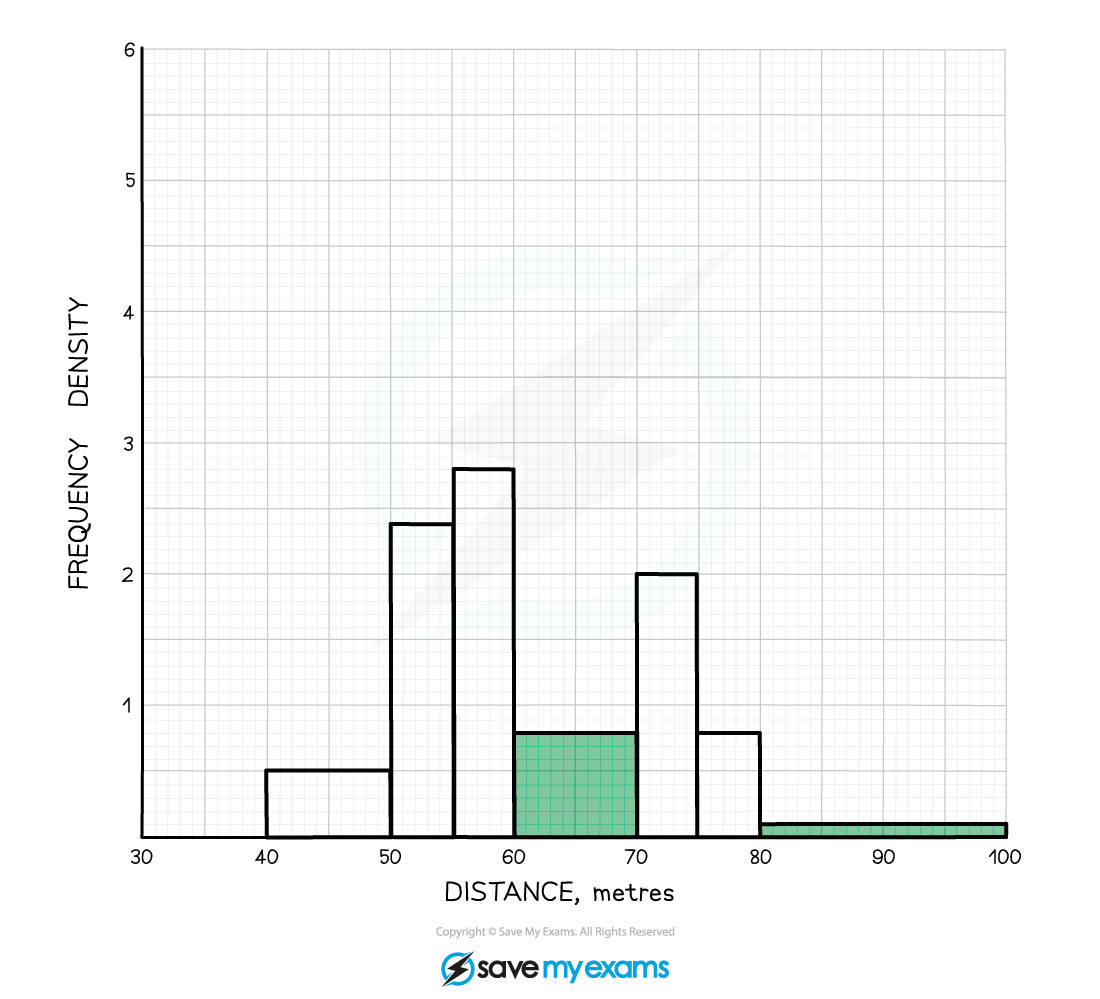
(a)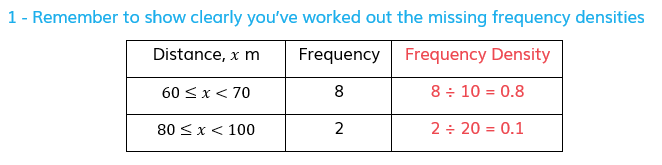
Worked Example
(b)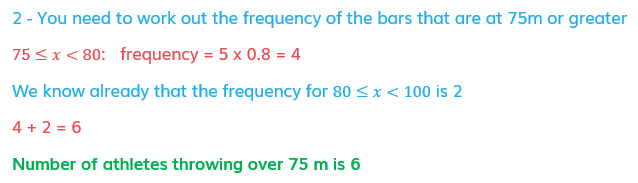
转载自savemyexam
以上就是关于【Edexcel IGCSE Maths 复习笔记 6.2.1 Histograms】的解答,如需了解学校/赛事/课程动态,可至翰林教育官网获取更多信息。
往期文章阅读推荐:
翰林独家 | 经济学竞赛核心精讲,一册打通NEC/IEO/USAEBO!
IGCSE全A*,A-Level阶段却崩了?别忽视IGCSE选课的重要性!


翰林AMC8视频课重磅上线!

国际竞赛真题资源免费领取






