- 翰林提供学术活动、国际课程、科研项目一站式留学背景提升服务!
- 400 888 0080
AQA A Level Biology复习笔记4.6.7 Quantitative Investigations of Variation
Quantitative Investigations of Variation
- Quantitative investigations of variation can involve the interpretation of mean values and their standard deviations
- A mean value describes the average value of a data set
- Standard deviation is a measure of the spread or dispersion of data around the mean
- A small standard deviation indicates that the results lie close to the mean (less variation)
- Large standard deviation indicates that the results are more spread out

Two graphs showing the distribution of values when the mean is the same but one has a large standard deviation and the other a small standard deviation
Comparison between groups
- When comparing the results from different groups or samples, using a measure of central tendency, such as the mean, can be quite misleading
- For example, looking at the two groups below
- Group A: 2, 15, 14, 15, 16, 15, 14
- Group B: 1, 3, 10, 15, 20, 22, 20
- Both groups have the same mean of 13
- However, most of the values in group A lie close to the mean, whereas in group B most values lie quite far from the mean
- For comparison between groups or samples it is better practice to use standard deviation in conjunction with the mean
- Whether or not the standard deviations of different data sets overlap can provide a lot of information:
- If there is an overlap between the standard deviations then it can be said that the results are not significantly different
- If there is no overlap between the standard deviations then it can be said that the results are significantly different
Worked Example
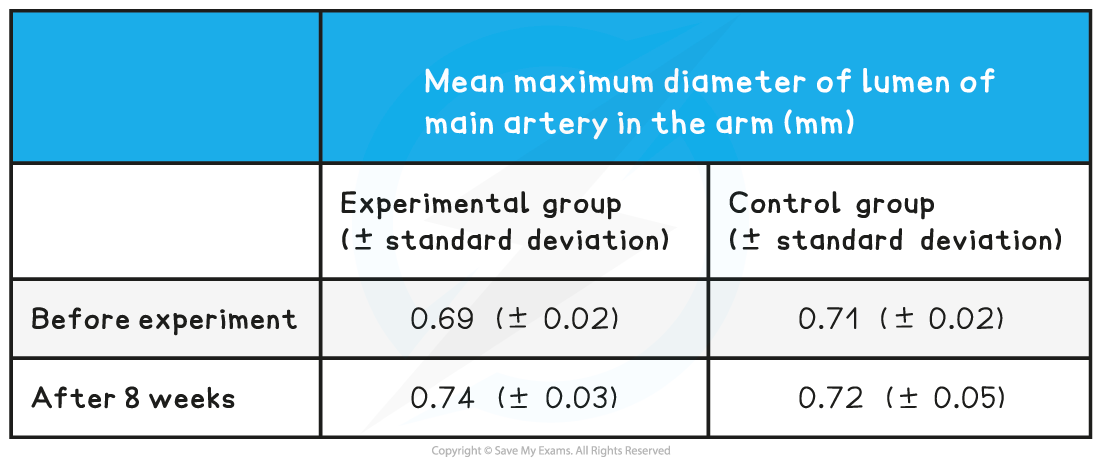
A group of scientists wanted to investigate the effects of a specific diet on the risk of coronary heart disease. One group was given a specific diet for 8 weeks, while the other group acted as a control. After the 8 weeks scientists measured the diameter of the lumen of the main artery in the arm of the volunteers. The results of the experiment are shown in Table 1 below:

Use the standard deviations above to evaluate whether the diet had a significant effect? [2 marks]
Step one: find the full range of values included within the standard deviations for each data set
Experimental group before: 0.67 to 0.71mm
Experimental group after: 0.71 to 0.77mm
Control group before: 0.69 to 0.73mm
Control group after: 0.67 to 0.77mm
Step two: use this information to form your answer
There is an overlap of standard deviations in the experimental group before and after the experiment (0.67~0.71mm and 0.71~0.77mm) so it can be said that the difference before and after the experiment is not significant; [1 mark]
There is also an overlap of standard deviations between the experimental and control groups after the eight weeks (0.71~0.77mm and 0.67~0.77mm) so it can be said that the difference between groups is not significant; [1 mark]
Exam Tip
You don’t need to include the range of values in your answer like we have done above. However we do recommend writing out the range of values for each data set before starting to answer the question. This way you can easily see any overlap in standard deviation!The standard deviations of a data set are not always presented in a table, they can also be represented by standard deviation error bars on a graph.
转载自savemyexams

最新发布
© 2025. All Rights Reserved. 沪ICP备2023009024号-1


