AQA A Level Biology复习笔记3.5.8 Interpreting Data on the Cardiovascular System

Interpreting Data Relating to the Cardiovascular System
- A cardiac cycle is the sequence of events that make up a single heartbeat
- It includes periods of heart muscle contraction and relaxation
- One cardiac cycle is followed by another in a continuous process
- There is no gap between cycles where blood stops flowing
- The contraction of the muscles in the wall of the heart reduces the volume of the heart chambers and increases the pressure of the blood within that chamber
- When the pressure within a chamber/vessel exceeds that in the next chamber/vessel the valves are forced open and the blood moves through
- When the muscles in the wall of the heart relax they recoil which increases the volume of the chamber/vessel and decreases the pressure so that the valves close
Analysing the cardiac cycle
- There are several key points to keep in mind when analysing the cardiac cycle
- The curves on the graph represent the pressure of the left atria, aorta and the left ventricle
- The points at which the curves cross each other are important because they indicate when valves open and close
Point A - both left atrium and left ventricle are relaxed
- Pressure sits at roughly 0 kPa
Between points A and B - atrial systole
- Left atria contracts and empties blood into the left ventricle
Point B - beginning of the ventricular systole
- Left ventricular pressure increases
- AV valve shuts
- Pressure in the left atria drops as the left atrium expands
Point C - pressure in the left ventricle exceeds that in the aorta
- Aortic valve opens
- Blood enters the aorta
Point D - diastole
- Left ventricle has been emptied of blood
- Muscles in the walls of the left ventricle relax and pressure falls below that in aorta
- Aortic valve closes
- AV valve opens
Point E - expansion of the left ventricle
- There is a short period of time during which the left ventricle expands
- This increases the internal volume of the left ventricle which decreases the pressure
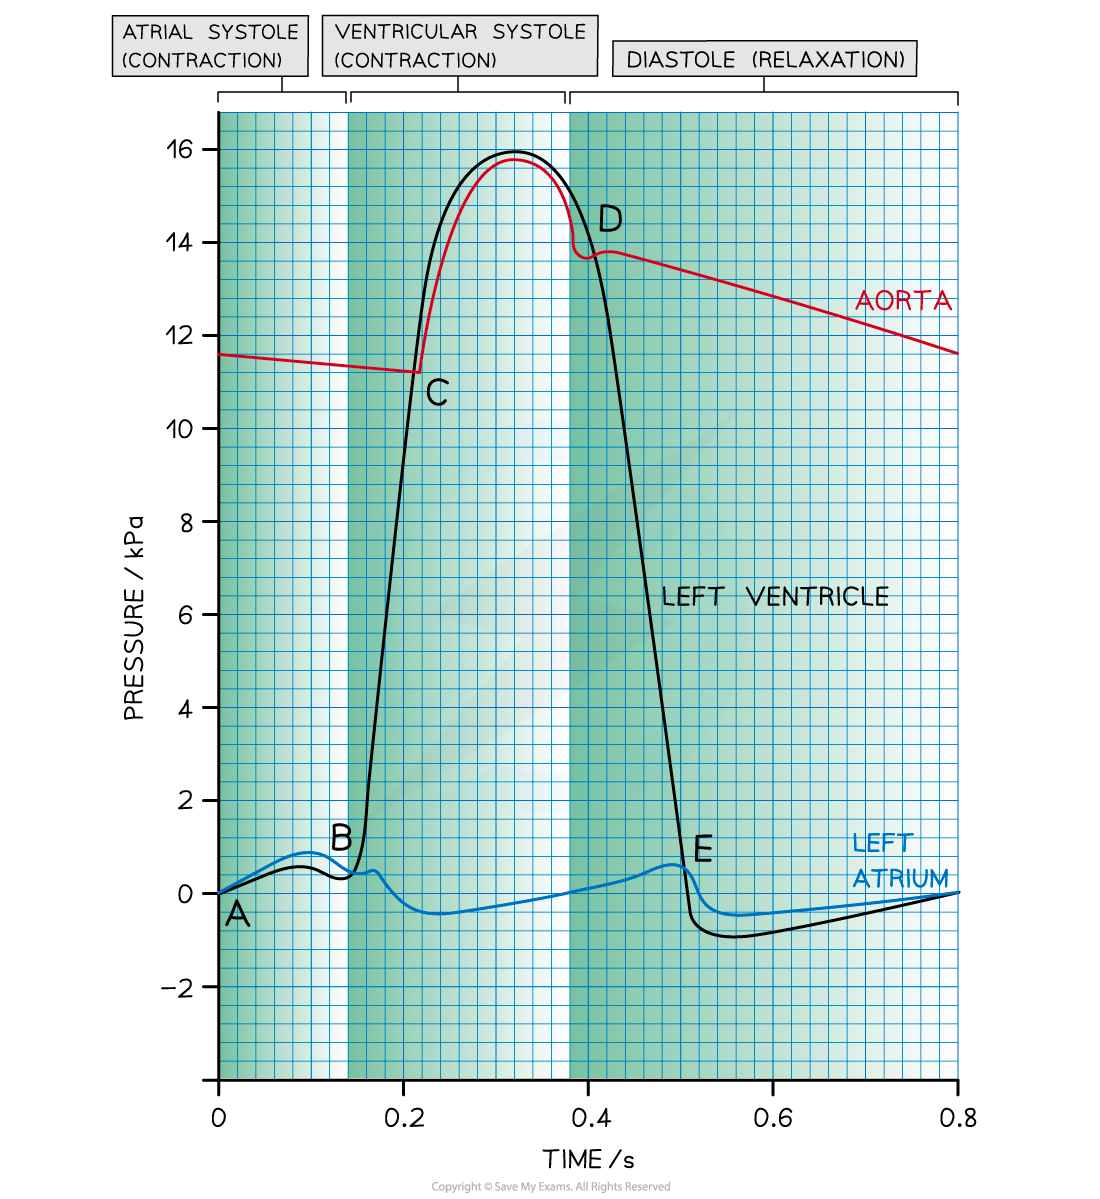
Image showing the pressure changes within the aorta, left atrium and left ventricle during the cardiac cycle
Risk factors and the incidence of cardiovascular disease
- Coronary heart disease (CHD) includes any condition that interferes with the coronary arteries which supply blood to the heart muscle
- Many factors can increase the risk of developing CHD
- Some factors are controllable while some factors can not be controlled
- The main risk factors for CHD include:
- Genetic factors - individuals can have a genetic predisposition that increases their chance of developing CHD
- Age and sex - risk of CHD increases with age and is much more likely to affect men
- High blood pressure - this can cause arteries to develop thicker walls, lumens to narrow, atheromas to develop and ventricles to enlarge
- Smoking - the chemical in tobacco can damage the heart and lungs and negatively impact blood pressure
- High concentrations of low-density lipoproteins (LDLs) in the blood - these are the lipoproteins that cause atheromas to develop. High-density lipoproteins (HDLs) are the healthier version that help to absorb excess cholesterol. The ratio of LDLs to HDLs can be calculated using blood samples
Conflicting Evidence
- All of the risk factors above can interact and affect one another
- The link between some risk factors can be very clear
- Obesity leads to high blood pressure as a diet of fatty foods leads to increased LDLs
- For many individuals, the chance of developing CHD is influenced by a number of different risk factors
- The interaction between risk factors can lead to conflicting evidence
- For example, it would seem illogical that an overweight smoker would not suffer from CHD but that overweight, non-smoker would
- The latter individual could have a strong genetic predisposition to CHD which when combined with high blood pressure from being overweight results in CHD
- It is therefore important to never state in exams that "eating fatty foods causes CHD" instead, it would be more correct to say "there is a positive correlation between the amount of fatty food you eat and the risk/incidence of CHD"
Exam Tip
The maximum pressure in the ventricles is substantially higher than in the atria. This is because there is much more muscle in the thick walls of the ventricles which can exert more force when they contract.
转载自savemyexams
以上就是关于【AQA A Level Biology复习笔记3.5.8 Interpreting Data on the Cardiovascular System】的解答,如需了解学校/赛事/课程动态,可至翰林教育官网获取更多信息。
往期文章阅读推荐:
翰林独家 | 经济学竞赛核心精讲,一册打通NEC/IEO/USAEBO!
2026 ALEVEL 夏考A率出炉!爱德思vs牛津AQA,哪些科目真的“好出分”?


翰林AMC8视频课重磅上线!

国际竞赛真题资源免费领取






